Fig. 3.
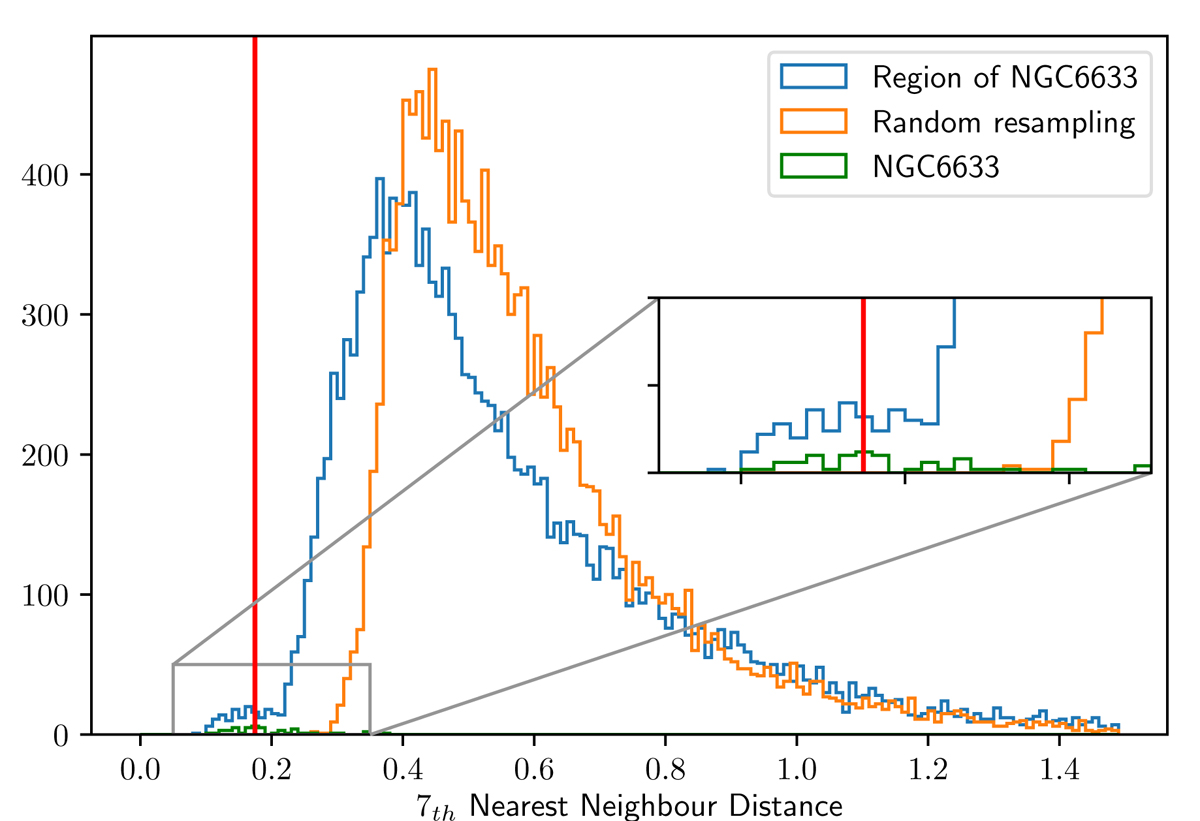
Histogram of the 7th-NNDs of the region around the cluster NGC 6633. The blue line shows the 7th-NND histogram of all the stars in that sky region in TGAS. Orange line shows the 7th-NND histogram of one realization of a random resample. Green line shows the 7th-NND histogram for the listed members of NGC 6633 (more visible in the zoom plot). The red line corresponds to the chosen value of ɛ in this region. The plot was made with the parameters L = 14 deg and minPts = 8.
Current usage metrics show cumulative count of Article Views (full-text article views including HTML views, PDF and ePub downloads, according to the available data) and Abstracts Views on Vision4Press platform.
Data correspond to usage on the plateform after 2015. The current usage metrics is available 48-96 hours after online publication and is updated daily on week days.
Initial download of the metrics may take a while.