Fig. 8
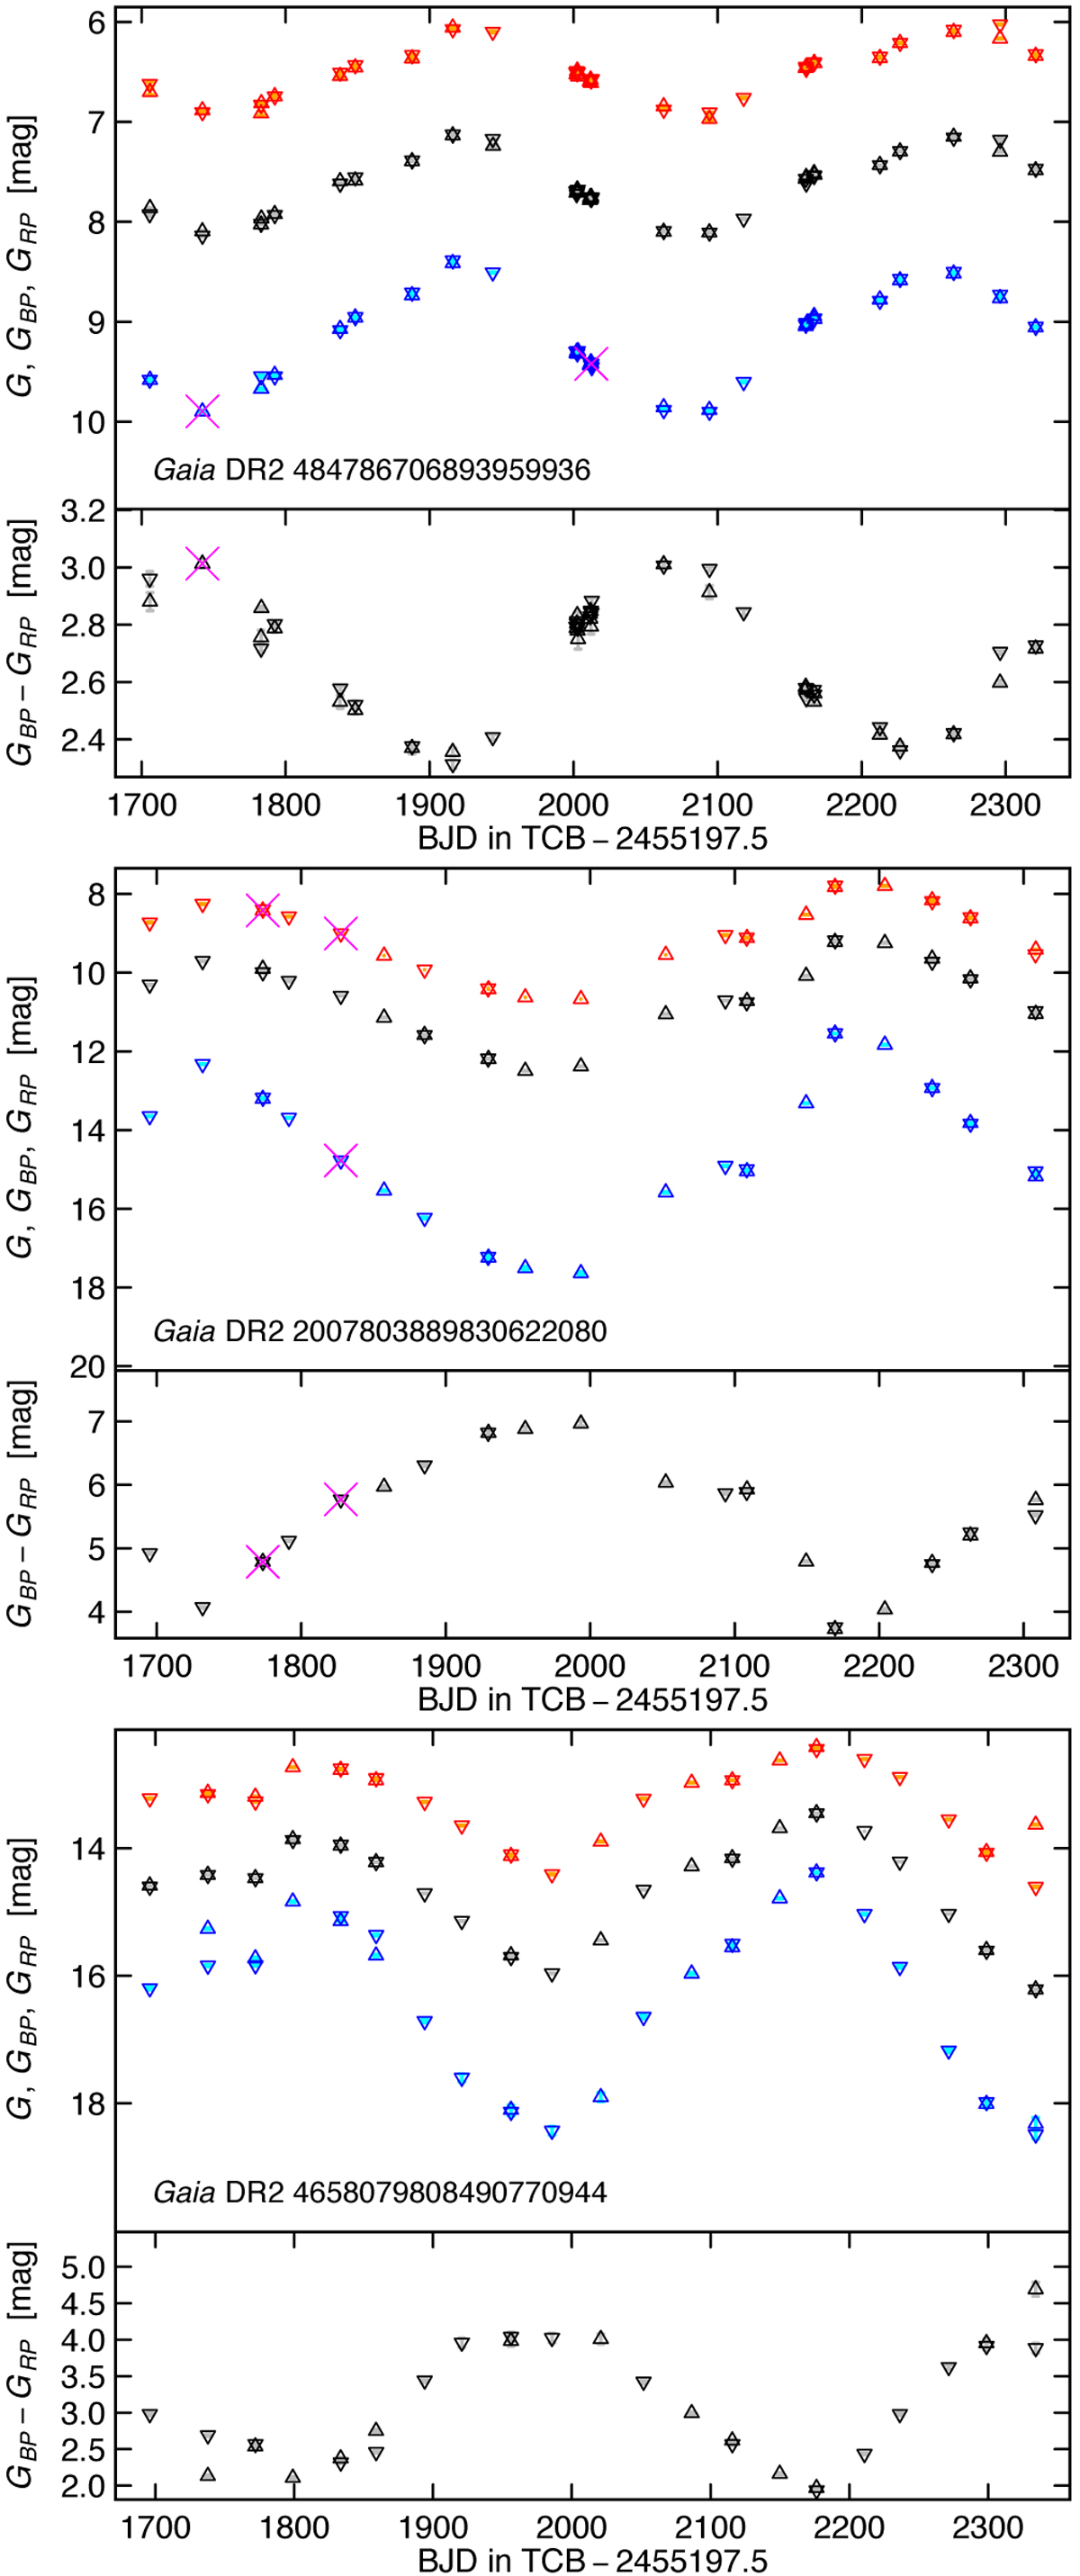
Light-curve examples of three LPV candidates with good time coverage, from bright (top figure) to faint (bottom figure). Upper panel in each sub-figure: black, blue, and red symbols identify G, GBP, and GRP e light curves, respectively, with their measurement uncertainties shown at each point in grey, cyan, and orange, respectively (the uncertainties are often too small to be visible on the magnitude ranges of the panels). Upward and downward triangles indicate measurements in Gaia preceding and following fields of view, respectively. Measurements that have been discarded in the variability processing pipeline are identified with magenta crosses (see text). Lower panel in each sub-figure: same as upper panel, but for the colour GBP − GRP e time-series.
Current usage metrics show cumulative count of Article Views (full-text article views including HTML views, PDF and ePub downloads, according to the available data) and Abstracts Views on Vision4Press platform.
Data correspond to usage on the plateform after 2015. The current usage metrics is available 48-96 hours after online publication and is updated daily on week days.
Initial download of the metrics may take a while.