Free Access
Fig. 7
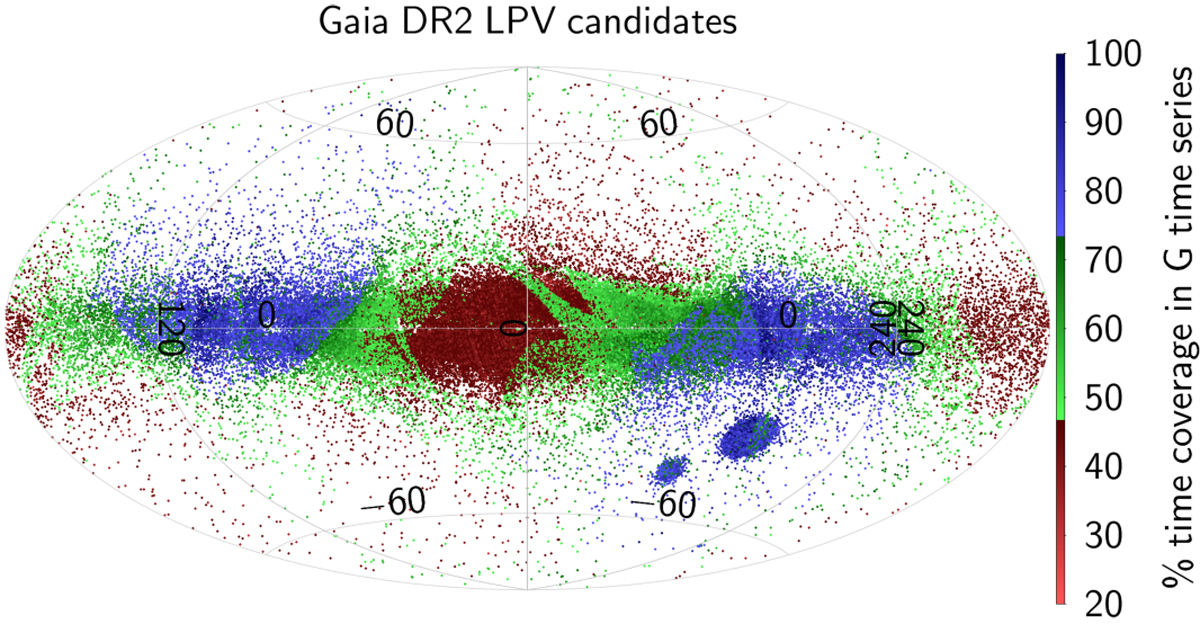
Sky distribution of the time coverage percentage (see Sect. 3.2) of G -band cleaned measurements within the time-series duration of each LPV candidate, according to the colour scale shown on the right of the figure.
Current usage metrics show cumulative count of Article Views (full-text article views including HTML views, PDF and ePub downloads, according to the available data) and Abstracts Views on Vision4Press platform.
Data correspond to usage on the plateform after 2015. The current usage metrics is available 48-96 hours after online publication and is updated daily on week days.
Initial download of the metrics may take a while.