Fig. C.1
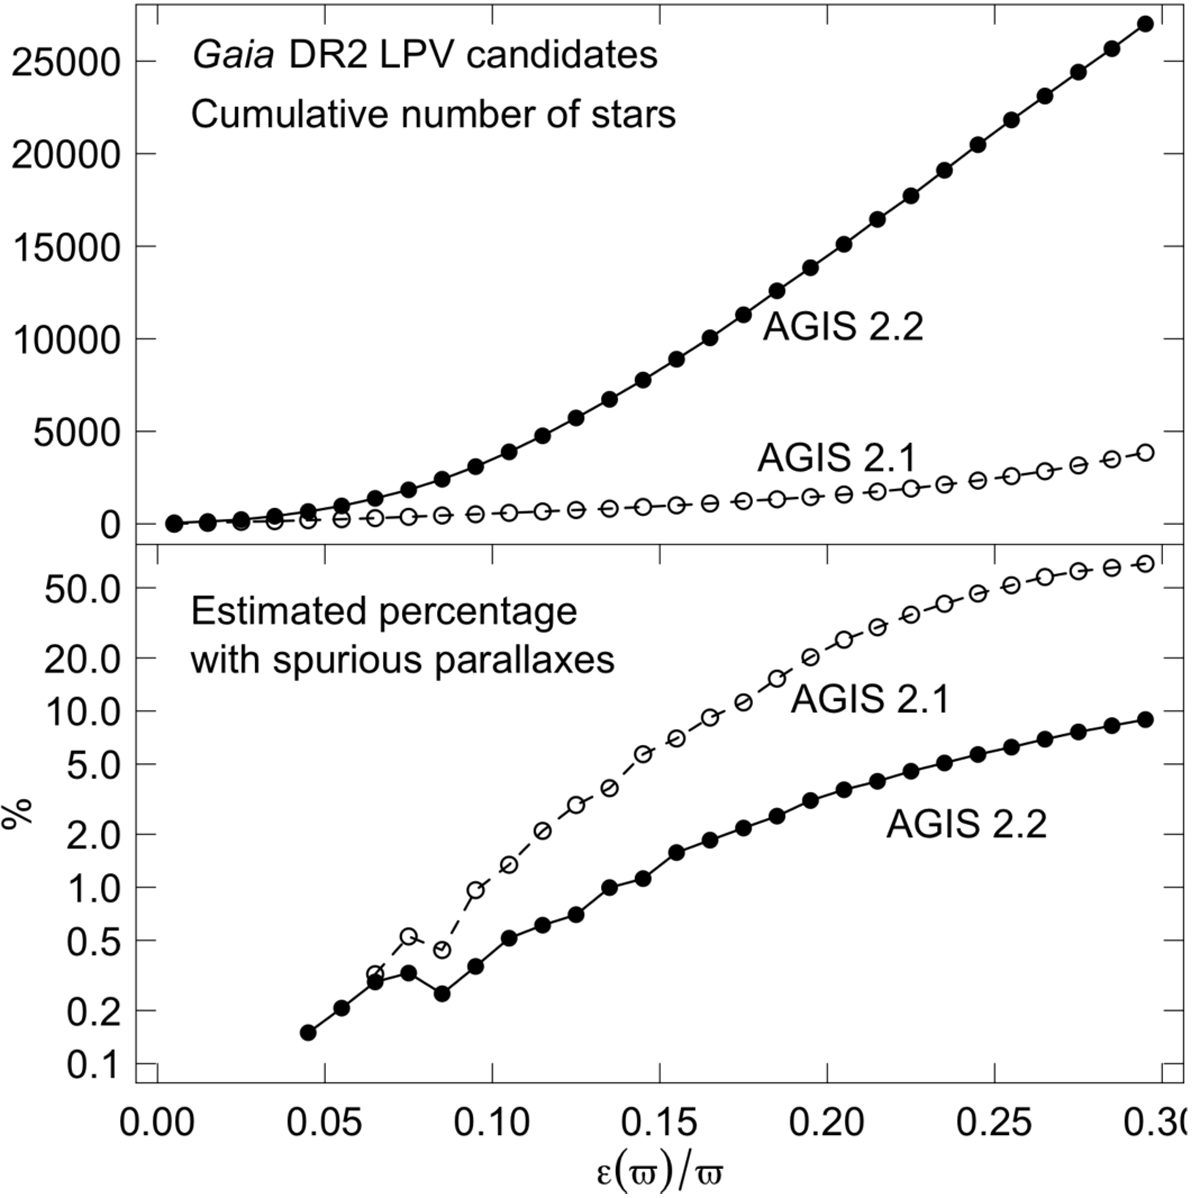
Top panel: cumulative distributions of the number of LPV candidates as a function of relative parallax uncertainties for the sample of sources with positive parallaxes. Open circles connected with a dashed line show the cumulative distribution for the parallaxes from AGIS 2.1 (preliminary results internal to DPAC), and filled circles connected with a solid line show the results from AGIS 2.2 (parallaxes published in DR2). Bottom panel: same as top panel, but for the percentage of spurious positive parallaxes in the set of LPV candidates with relative parallax uncertainties below any value shown on the X-axis.
Current usage metrics show cumulative count of Article Views (full-text article views including HTML views, PDF and ePub downloads, according to the available data) and Abstracts Views on Vision4Press platform.
Data correspond to usage on the plateform after 2015. The current usage metrics is available 48-96 hours after online publication and is updated daily on week days.
Initial download of the metrics may take a while.