Free Access
Fig. 5
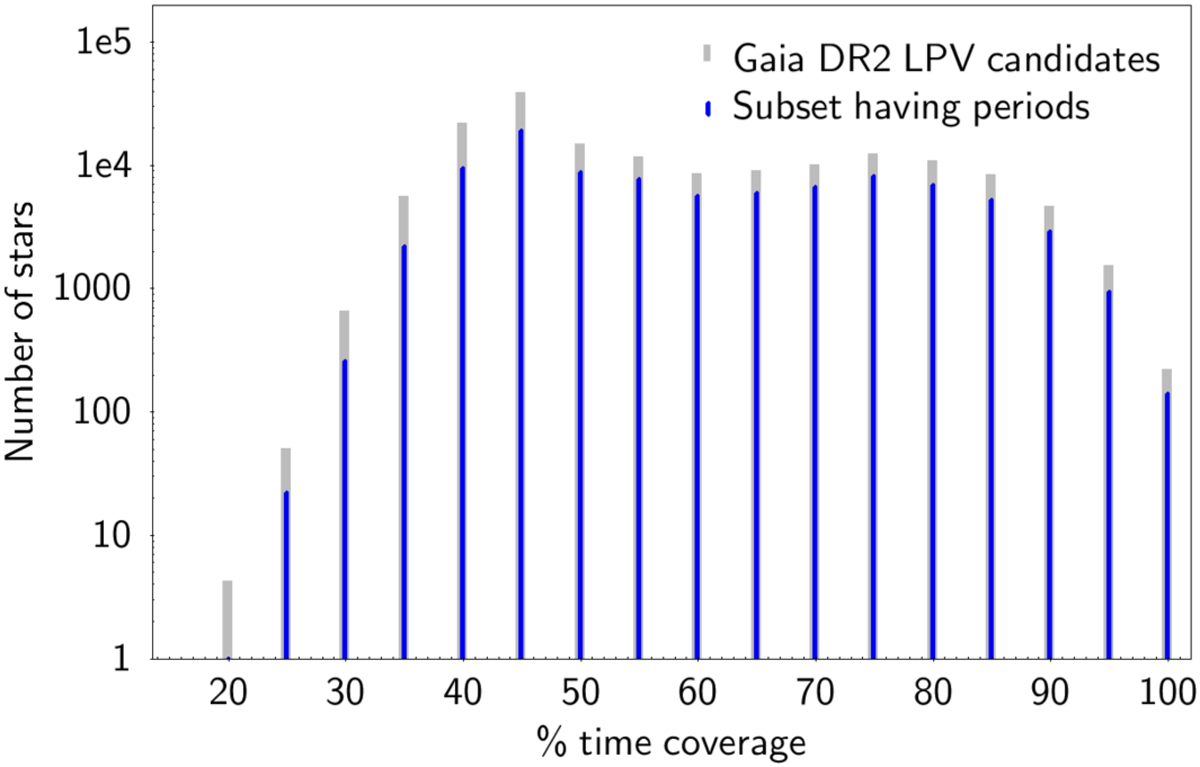
Histogram of the time coverage (see Sect. 3.2), in percentage, of measurements in the cleaned G time-series of all Gaia DR2 LPV candidates (grey bars) and of the subset with published periods (blue bars).
Current usage metrics show cumulative count of Article Views (full-text article views including HTML views, PDF and ePub downloads, according to the available data) and Abstracts Views on Vision4Press platform.
Data correspond to usage on the plateform after 2015. The current usage metrics is available 48-96 hours after online publication and is updated daily on week days.
Initial download of the metrics may take a while.