Fig. 49
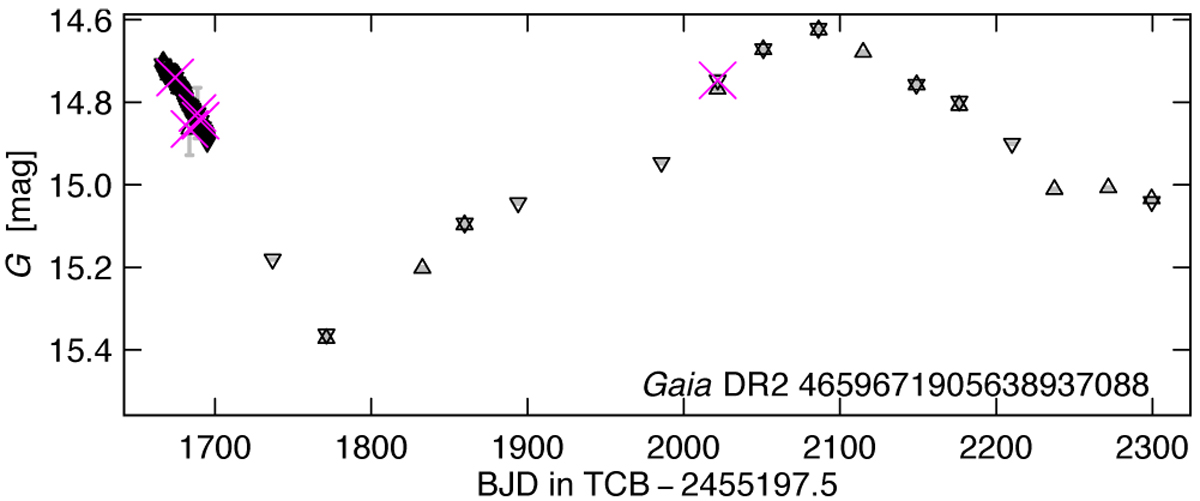
G-band light curve example of an LPV in the LMC near the south ecliptic pole. It shows the large number of observations gathered during the first month of commissioning phase, due to the use of a specific EPSL, which is at the origin of the apparent deficiency of LPV candidates seen in Fig. 45 in the region of the LMC near the ecliptic pole (see text). The black upward- and downward-pointing triangles and magenta crosses have the same meanings as in Fig. 8.
Current usage metrics show cumulative count of Article Views (full-text article views including HTML views, PDF and ePub downloads, according to the available data) and Abstracts Views on Vision4Press platform.
Data correspond to usage on the plateform after 2015. The current usage metrics is available 48-96 hours after online publication and is updated daily on week days.
Initial download of the metrics may take a while.