Fig. 42
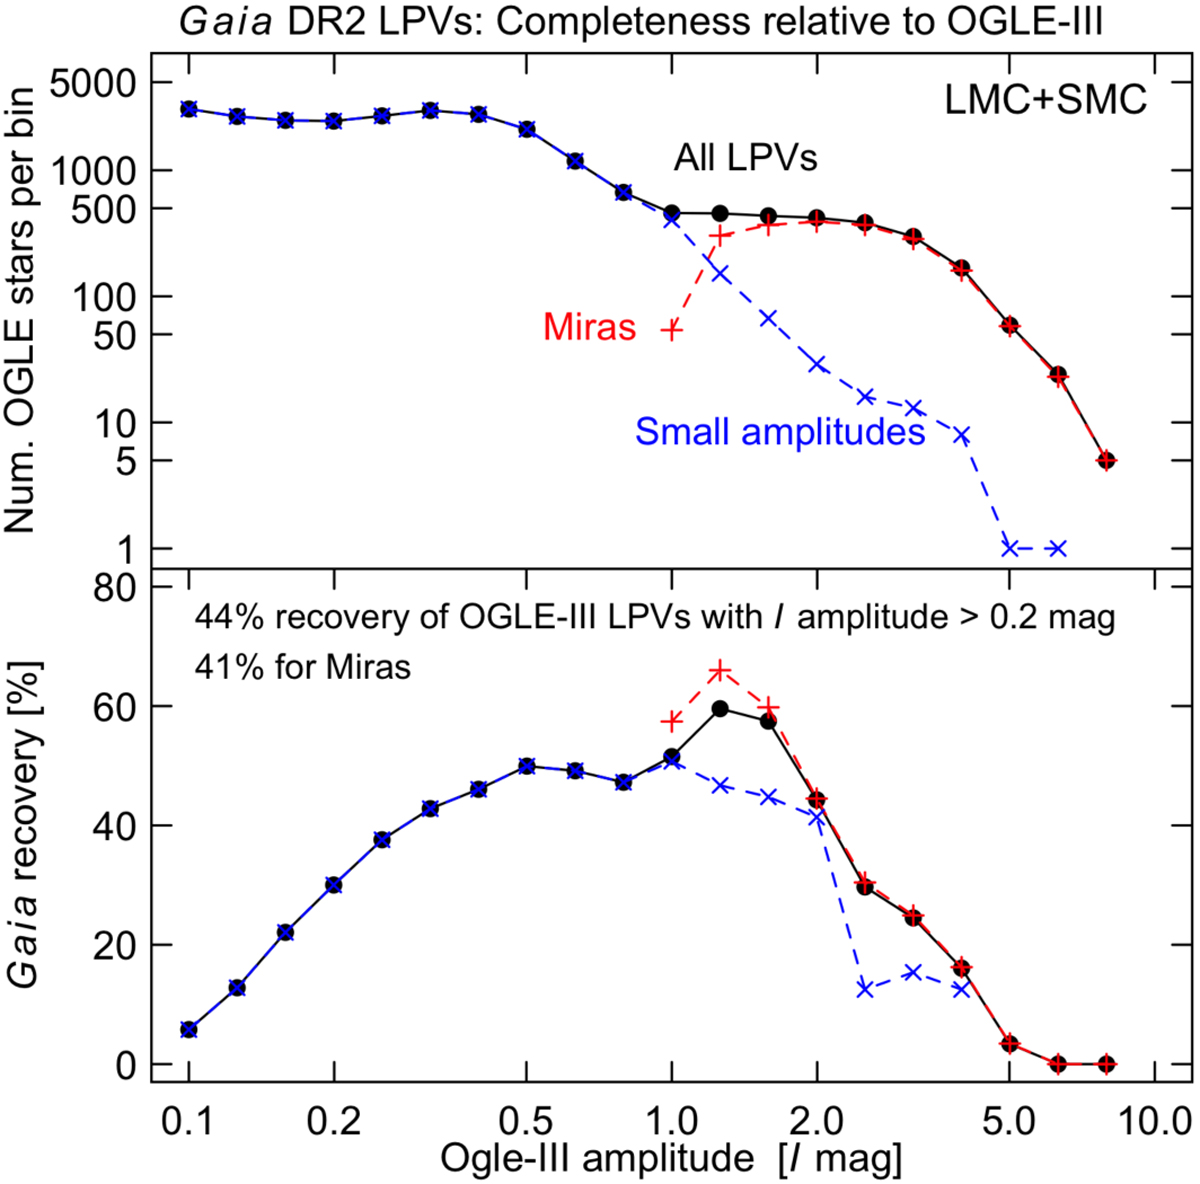
Top panel: number of LPVs reported in the OGLE-III catalogue towards the LMC and SMC as a function of OGLE I-band variability amplitude. The number of sources are given per 0.1-width bins of log amplitude. The group classified as Miras in the OGLE catalogue is shown as red pluses connected with a red dashed line, and the group combining all other LPVs is shown as blue crosses connected with a blue dashed line. The combined group of all LPVs is shown as black filled circles connected with a solid line. Bottom panel: Gaia recovery fraction of OGLE-III LPVs as a function of OGLE-III I-band variability amplitude for the group of LPVs shown in the top panel. The recovery fraction is computed per log amplitude bin as the ratio of the number of OGLE-III crossmatches in Gaia DR2 to the number of OGLE-III LPVs in the considered amplitude bin. Marker and line properties for each of the three groups are identical to those used in the top panel.
Current usage metrics show cumulative count of Article Views (full-text article views including HTML views, PDF and ePub downloads, according to the available data) and Abstracts Views on Vision4Press platform.
Data correspond to usage on the plateform after 2015. The current usage metrics is available 48-96 hours after online publication and is updated daily on week days.
Initial download of the metrics may take a while.