Fig. 36
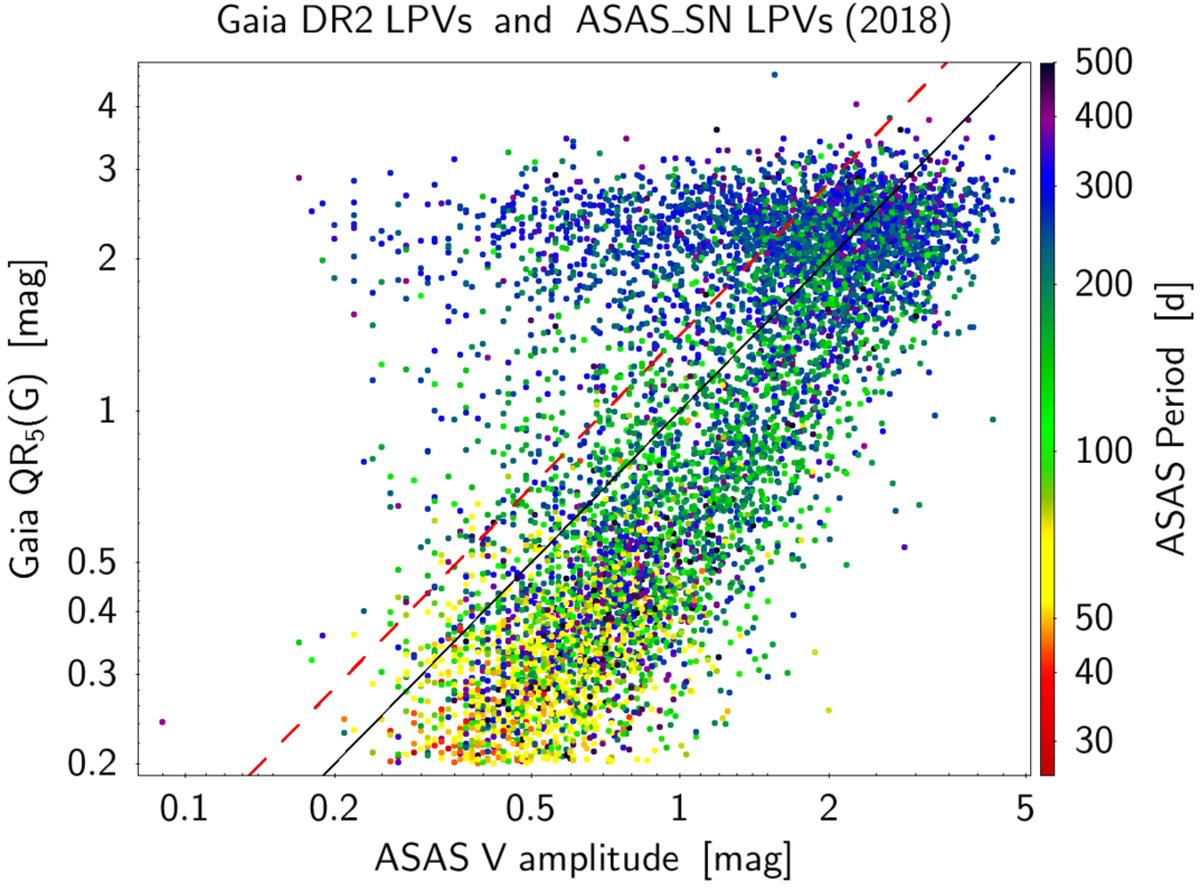
Comparison of Gaia amplitudes (5–95% quantile range QR5 of the cleaned G time-series) to ASAS_SN amplitudes (V band) of the 6915 Gaia –ASAS_SN LPV crossmatches. The colour of each point is related to the periods published by ASAS_SN periods according to the colour scale shown on the right of the figure. A diagonal line is drawn in black to guide the eye. Potential ASAS_SN-blended sources are preferentially located above the dashed red line.
Current usage metrics show cumulative count of Article Views (full-text article views including HTML views, PDF and ePub downloads, according to the available data) and Abstracts Views on Vision4Press platform.
Data correspond to usage on the plateform after 2015. The current usage metrics is available 48-96 hours after online publication and is updated daily on week days.
Initial download of the metrics may take a while.