Fig. 30
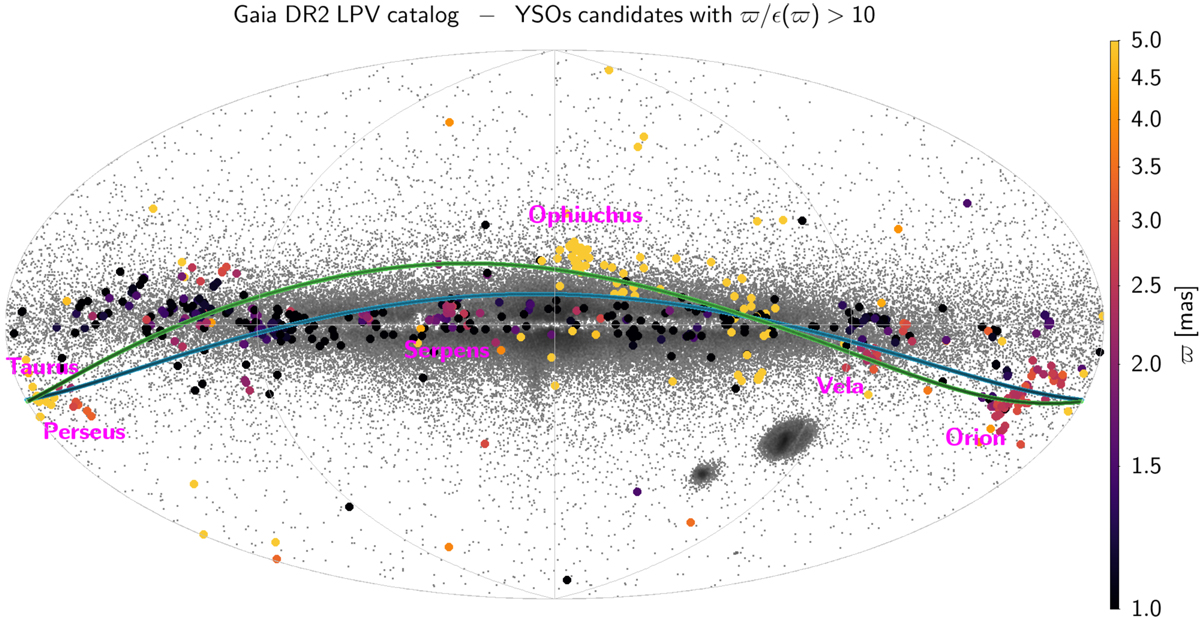
Sky distribution, in Galactic coordinates, of YSO candidates (large filled circles) in the Gaia DR2 catalogue of LPVs with ϖ∕ϵ(ϖ) > 10. The colour of the markers is related to the parallax according to the colour scale shown on the right of the figure (sources with parallaxes below the minimum or above the maximum values shown on the scale are coloured with the colour at the respective end of the scale). The background small grey points represent all LPV candidates in the catalogue. The location of the Gould belt determined from regions of stellar formation and dark clouds (Taylor et al. 1987) are indicated bythe green and blue lines, respectively, and its main stellar associations are labelled in magenta.
Current usage metrics show cumulative count of Article Views (full-text article views including HTML views, PDF and ePub downloads, according to the available data) and Abstracts Views on Vision4Press platform.
Data correspond to usage on the plateform after 2015. The current usage metrics is available 48-96 hours after online publication and is updated daily on week days.
Initial download of the metrics may take a while.