Fig. 29
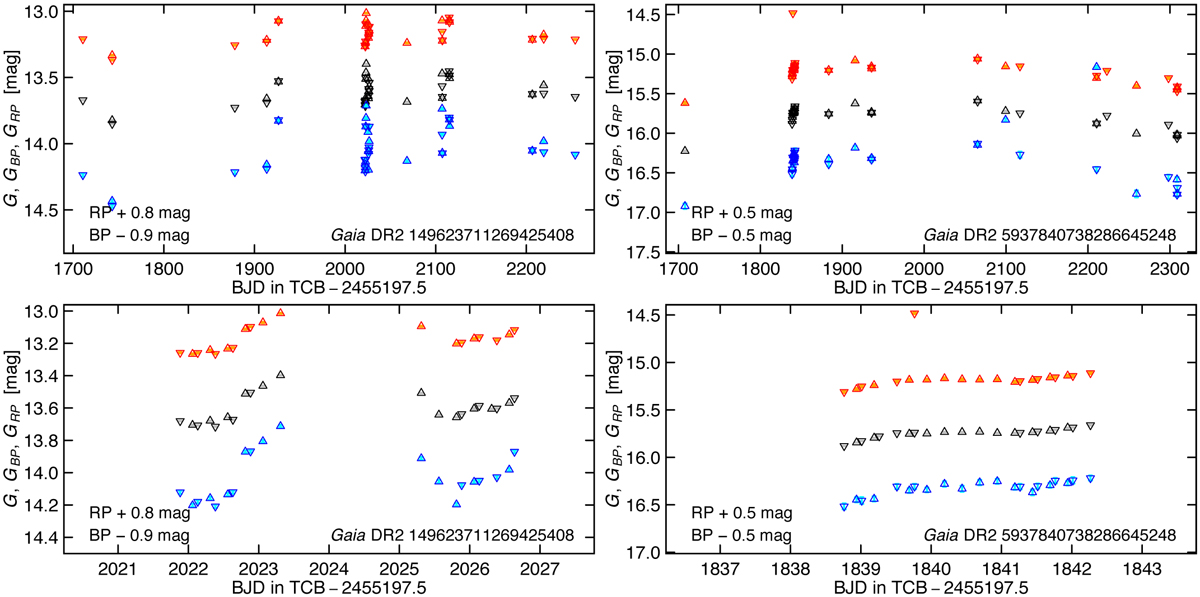
Top panels: light curve examples of two YSOs present in the Gaia DR2 catalogue of LPV candidates. The meaning of the symbols is identical to that in Fig. 8. The GBP and GRP e magnitudes are shifted by the amount indicated in each panel for better visibility of the light variations. Bottom panels: same as the top panels, but zoomed on a 7-day time interval around a concentration of measurements in time.
Current usage metrics show cumulative count of Article Views (full-text article views including HTML views, PDF and ePub downloads, according to the available data) and Abstracts Views on Vision4Press platform.
Data correspond to usage on the plateform after 2015. The current usage metrics is available 48-96 hours after online publication and is updated daily on week days.
Initial download of the metrics may take a while.