Fig. 28
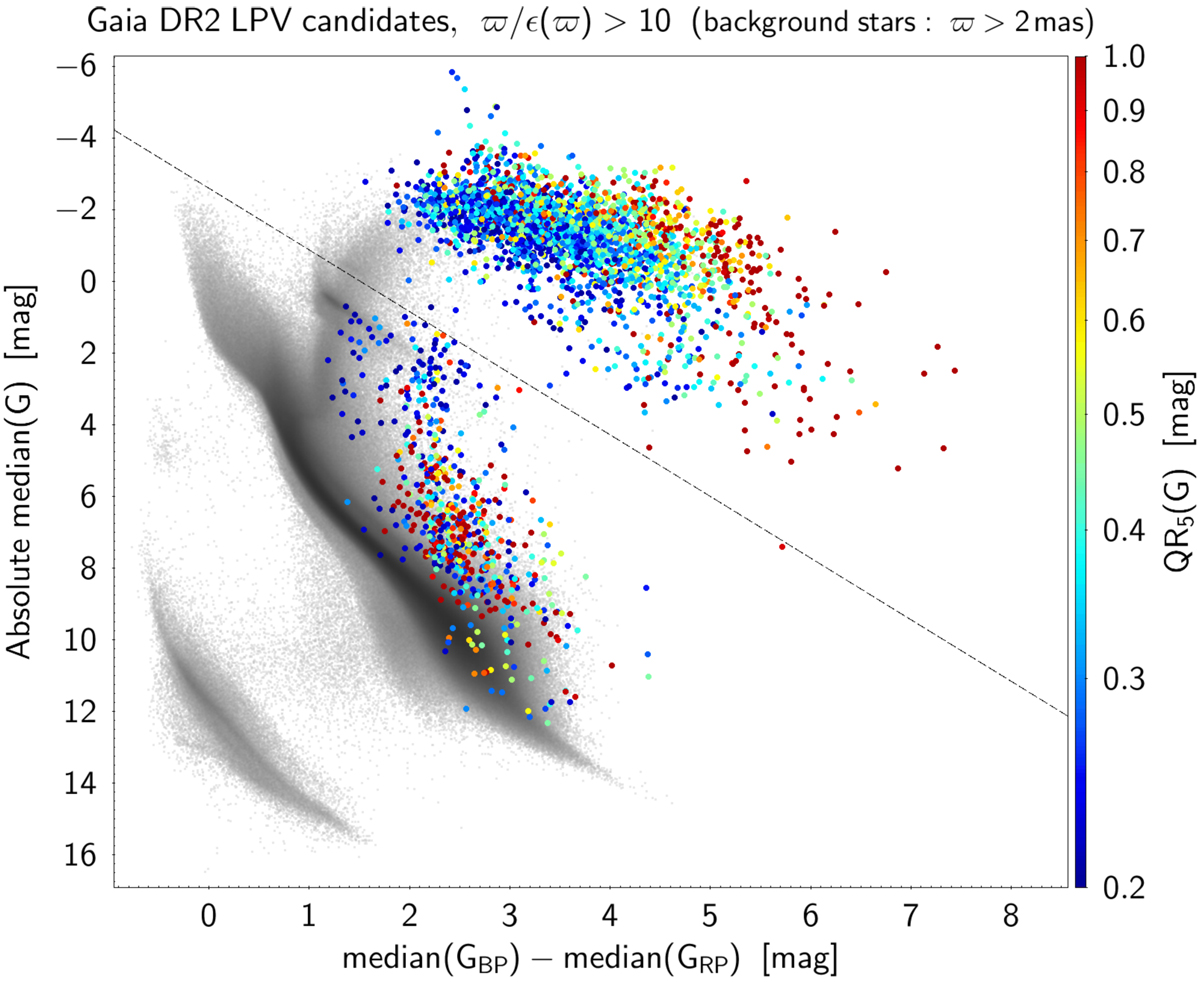
Observational HR diagram. Colour points represent the sources from the DR2 LPV catalogue that have positive ϵ(ϖ)∕ϖ < 0.1. The colour of the points is related to the G variability amplitude, measured by the 5–95% quantile range QR5 of the cleaned G time-series, according to the colour scale on the right of the figure (the upper limit of the colour scale has been truncated to QR5 = 1 mag for better visibility, all objects with QR5 > 1 mag being plotted in red). The background grey points represent the sample of stars from the whole Gaia DR2 catalogue that have ϖ > 2 mas and ϵ(ϖ)∕ϖ < 0.1. The dotted line separates LPV candidates from YSO candidates (see text).
Current usage metrics show cumulative count of Article Views (full-text article views including HTML views, PDF and ePub downloads, according to the available data) and Abstracts Views on Vision4Press platform.
Data correspond to usage on the plateform after 2015. The current usage metrics is available 48-96 hours after online publication and is updated daily on week days.
Initial download of the metrics may take a while.