Fig. 27
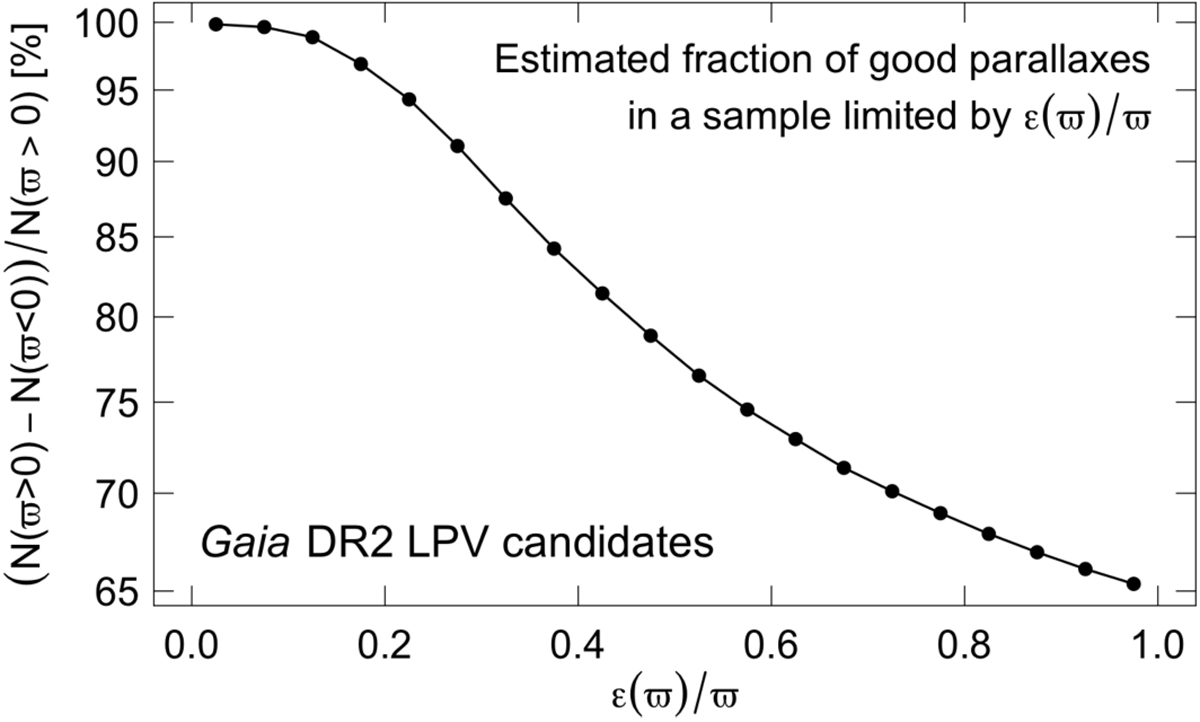
Estimated percentage of good parallaxes in a sample of LPVs limited by an upper limit on the relative parallax uncertainty. The figure plots, as a function of this relative parallax uncertainty limit, [N(ϖ > 0) − N(ϖ < 0)]∕N(ϖ > 0), where N(ϖ > 0) is the number of LPVs in the sample with positive parallaxes, and N(ϖ > 0) is the number of LPVs with negative parallaxes.
Current usage metrics show cumulative count of Article Views (full-text article views including HTML views, PDF and ePub downloads, according to the available data) and Abstracts Views on Vision4Press platform.
Data correspond to usage on the plateform after 2015. The current usage metrics is available 48-96 hours after online publication and is updated daily on week days.
Initial download of the metrics may take a while.