Fig. 21
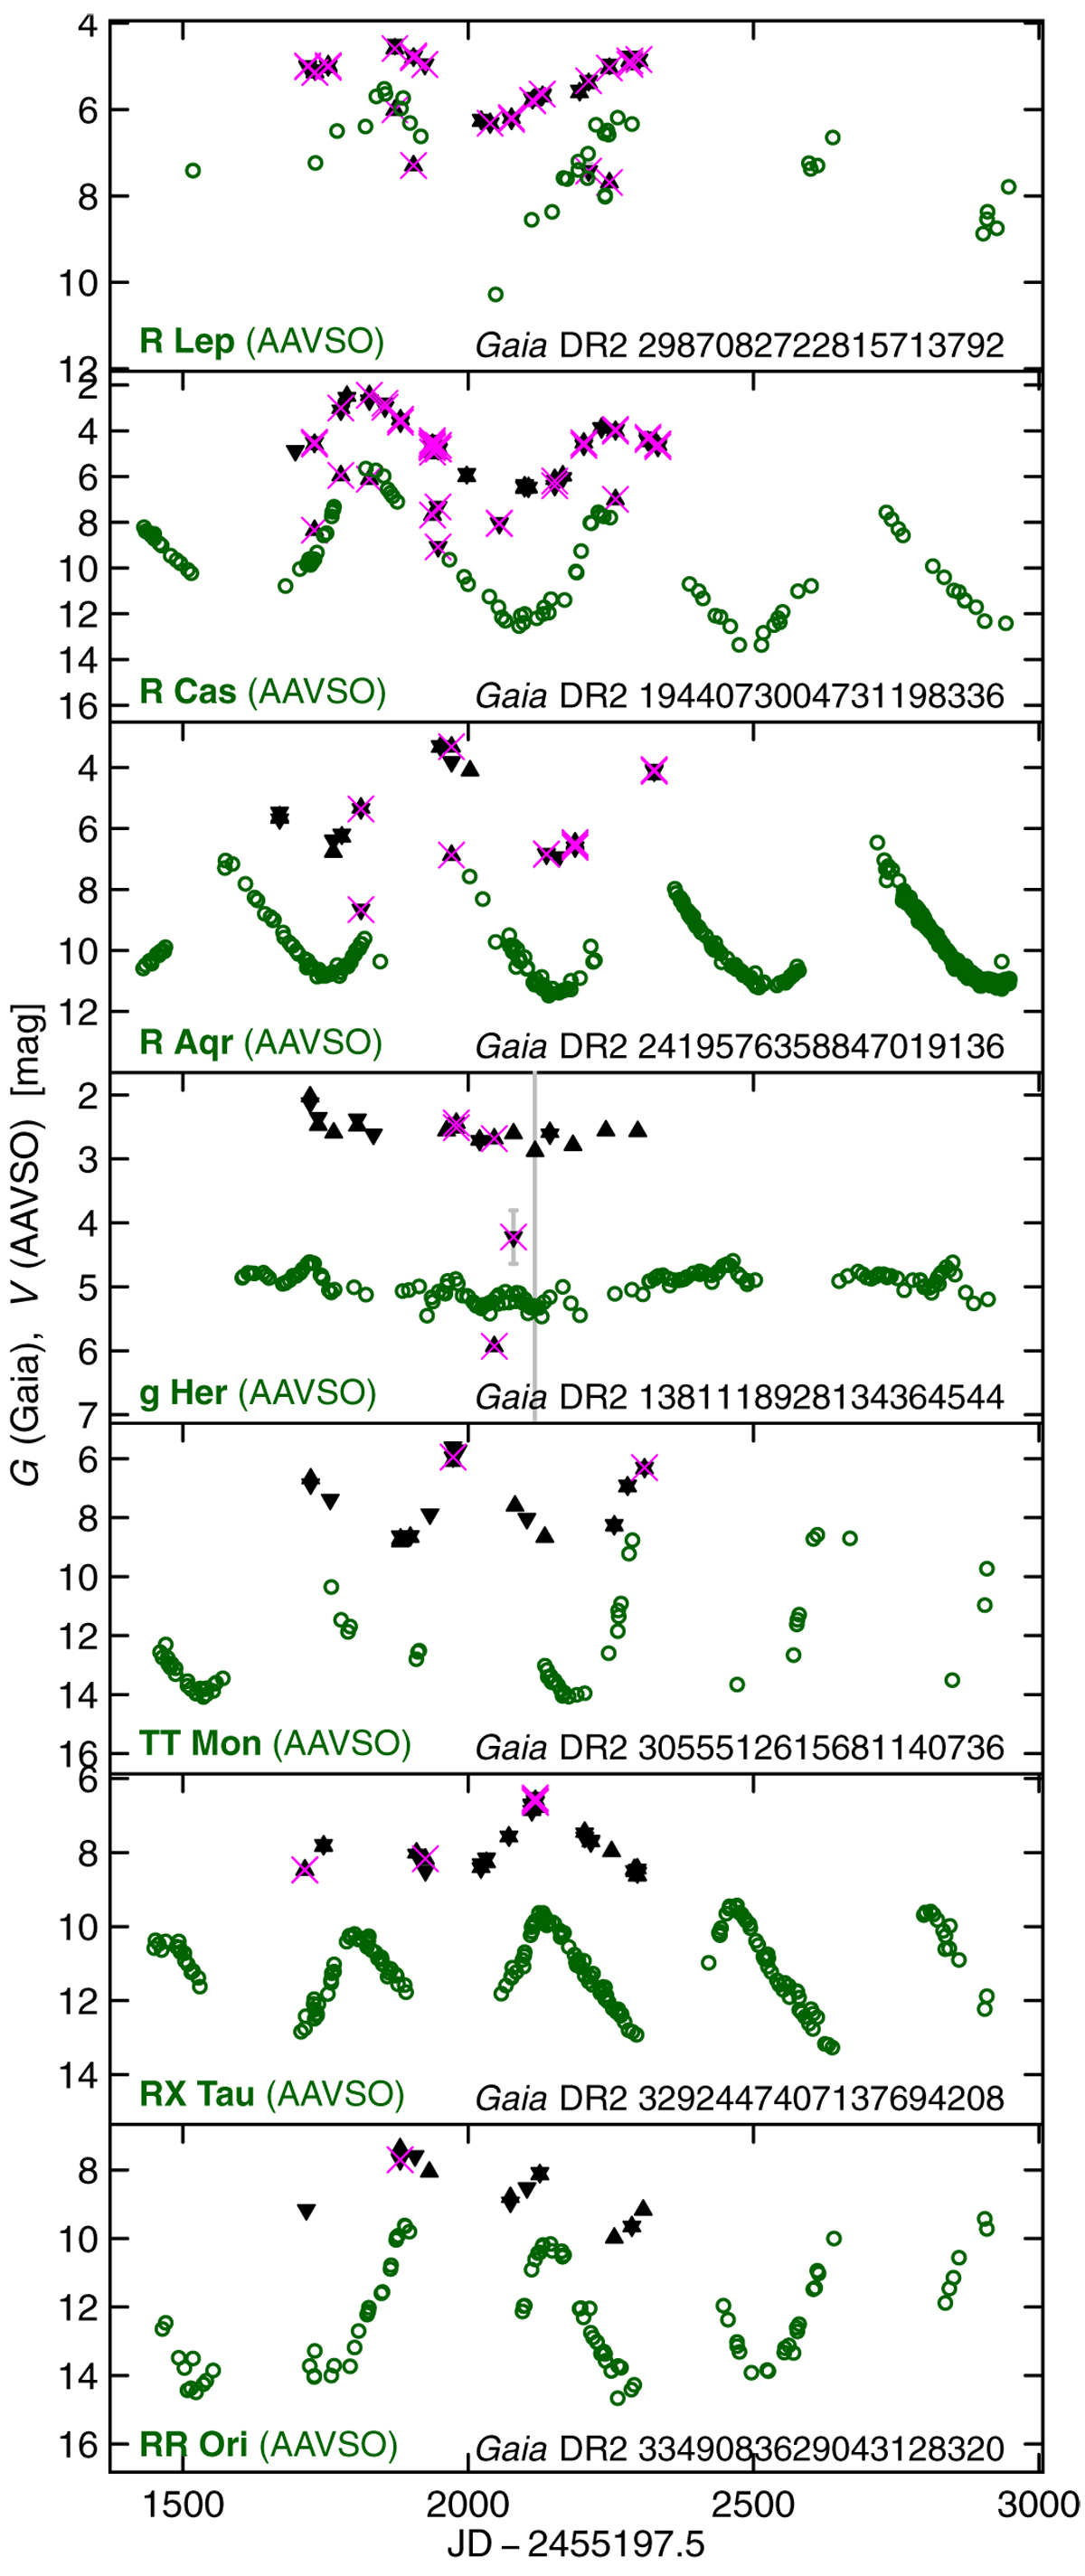
Light-curve examples of the seven first LPVs listed in Table 2. The AAVSO V magnitudes are shown as green open circles, and the Gaia G magnitudes as black filled triangles (downward-pointing and upward-pointing triangles for measurements in the Gaia preceding and following fields of view). The magenta cross markers identify Gaia measurements that havebeen disregarded in the Gaia time-series processing pipeline (see text). The uncertainties in the Gaia measurements are drawn as grey vertical bars, but they are within the size of the filled triangles in most cases. In the Gaia light curve of g Her, an outlier measurement is present outside the Y -axis range at G > 7 mag, the uncertainty of which is visible as a vertical grey line.
Current usage metrics show cumulative count of Article Views (full-text article views including HTML views, PDF and ePub downloads, according to the available data) and Abstracts Views on Vision4Press platform.
Data correspond to usage on the plateform after 2015. The current usage metrics is available 48-96 hours after online publication and is updated daily on week days.
Initial download of the metrics may take a while.