Free Access
Fig. 2
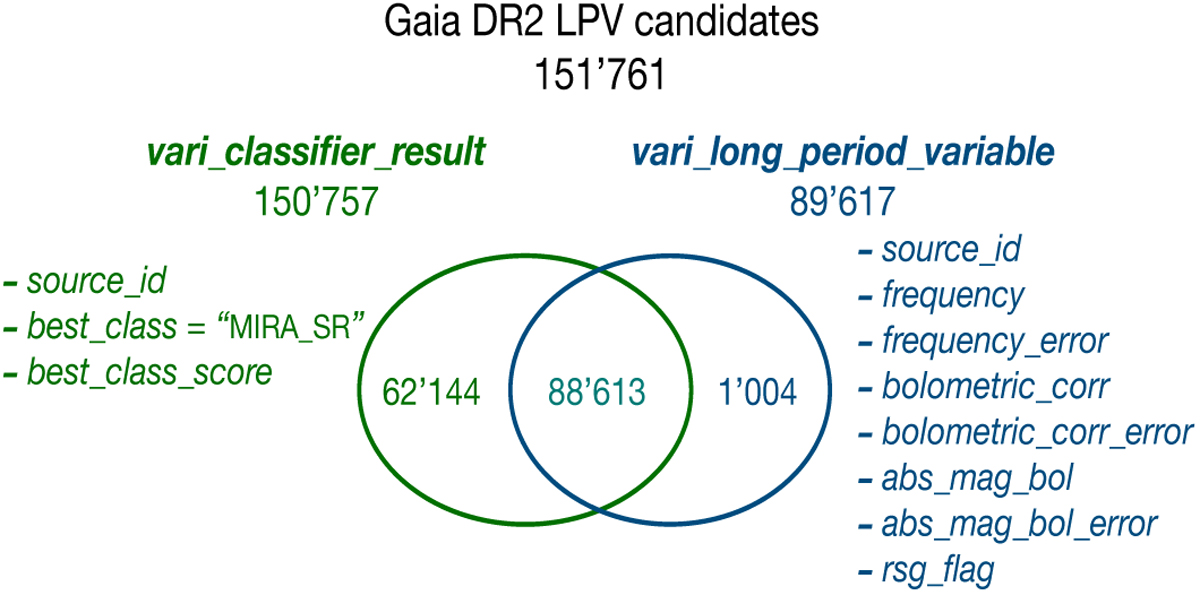
Venn diagram of the repartition of the Gaia DR2 LPV candidates in the vari_classifier_result (left in the figure) and vari_long_period_variable (right in the figure) tables published in Gaia DR2. The data fields available in each table are listed in the figure below the corresponding table name.
Current usage metrics show cumulative count of Article Views (full-text article views including HTML views, PDF and ePub downloads, according to the available data) and Abstracts Views on Vision4Press platform.
Data correspond to usage on the plateform after 2015. The current usage metrics is available 48-96 hours after online publication and is updated daily on week days.
Initial download of the metrics may take a while.