Fig. 17
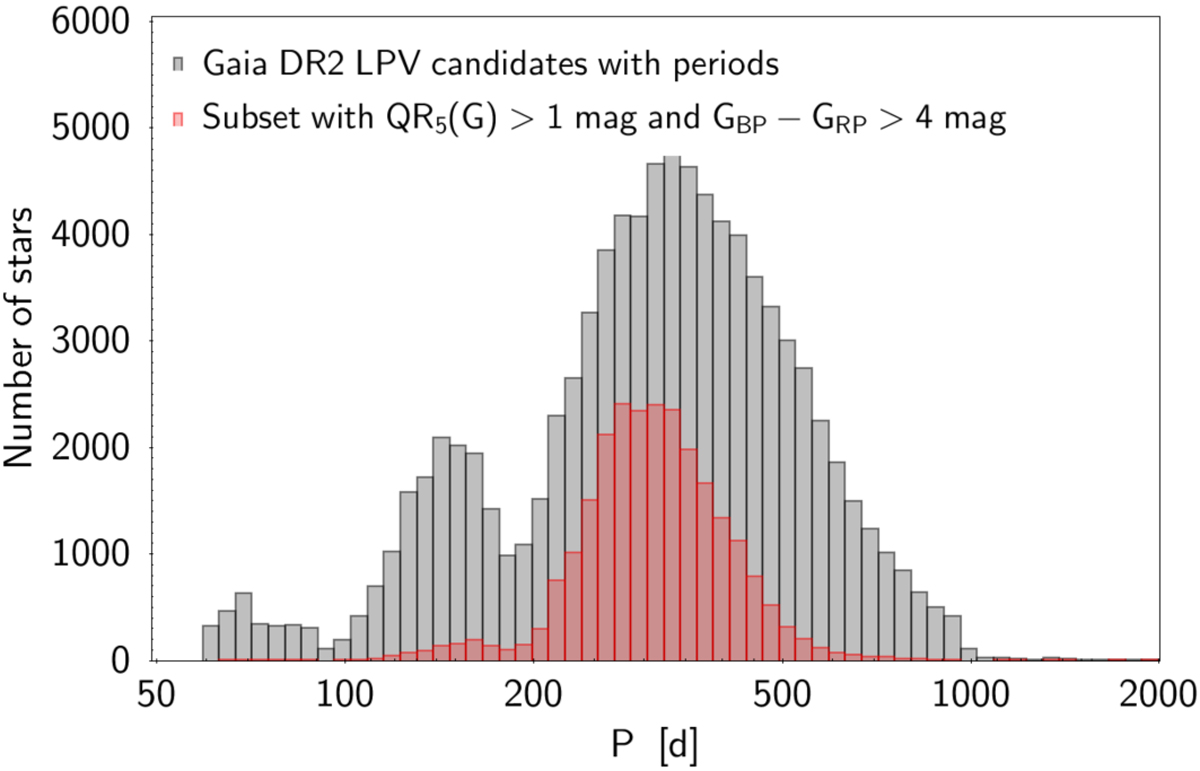
Histogram, in grey, of the periods published in the DR2 catalogue of LPV candidates. The axis has been limited to P < 2000 d for bettter visibility. There are 24 additional sources with periods above this limit. In red we show the subset containing Mira candidates with GBP − GRP ecolours larger than 4 mag and G amplitudes larger than 1 mag as measured by the 5–95% quantile range QR5 of the G light curve.
Current usage metrics show cumulative count of Article Views (full-text article views including HTML views, PDF and ePub downloads, according to the available data) and Abstracts Views on Vision4Press platform.
Data correspond to usage on the plateform after 2015. The current usage metrics is available 48-96 hours after online publication and is updated daily on week days.
Initial download of the metrics may take a while.