Fig. 14
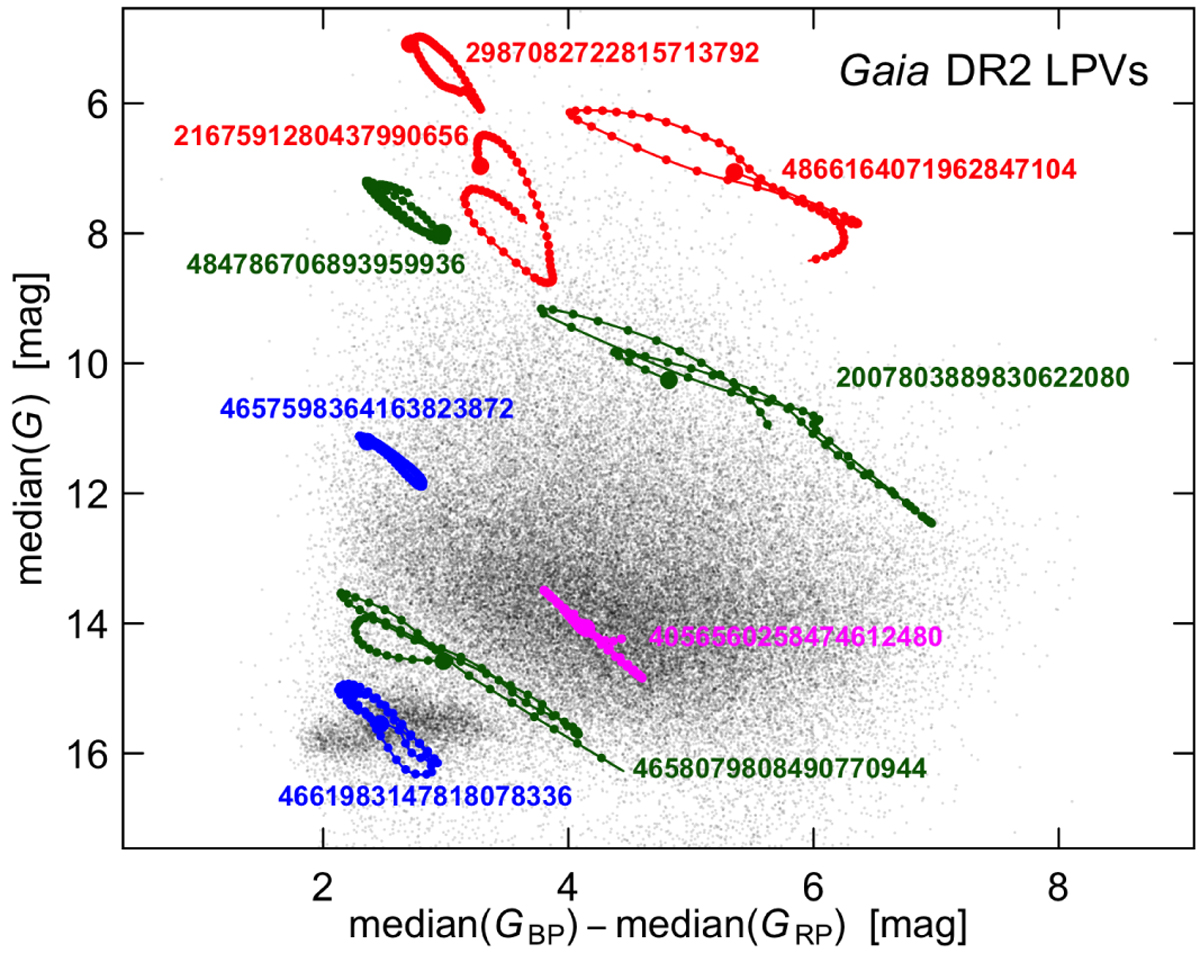
Loops performed in the CMD by the LPVs shown as examples in Figs. 8 (loops drawn in green), 9 (in blue), 10 (in magenta, only the source in the direction of the bulge is shown), and 12 (in red). The loops are drawn from smoothed fits to the G and colour time-series shown in these figures. The starting point is shown as a large filled circle for each source, and small filled circlesmark every subsequent 10-day interval. The Gaia DR2 source IDs are indicated next to each loop. The background grey points represent a random sample of 40% of the Gaia DR2 catalogue of LPV candidates, further plotted witha colour transparency of 15% to avoid saturation in the figure.
Current usage metrics show cumulative count of Article Views (full-text article views including HTML views, PDF and ePub downloads, according to the available data) and Abstracts Views on Vision4Press platform.
Data correspond to usage on the plateform after 2015. The current usage metrics is available 48-96 hours after online publication and is updated daily on week days.
Initial download of the metrics may take a while.