Free Access
Fig. 11
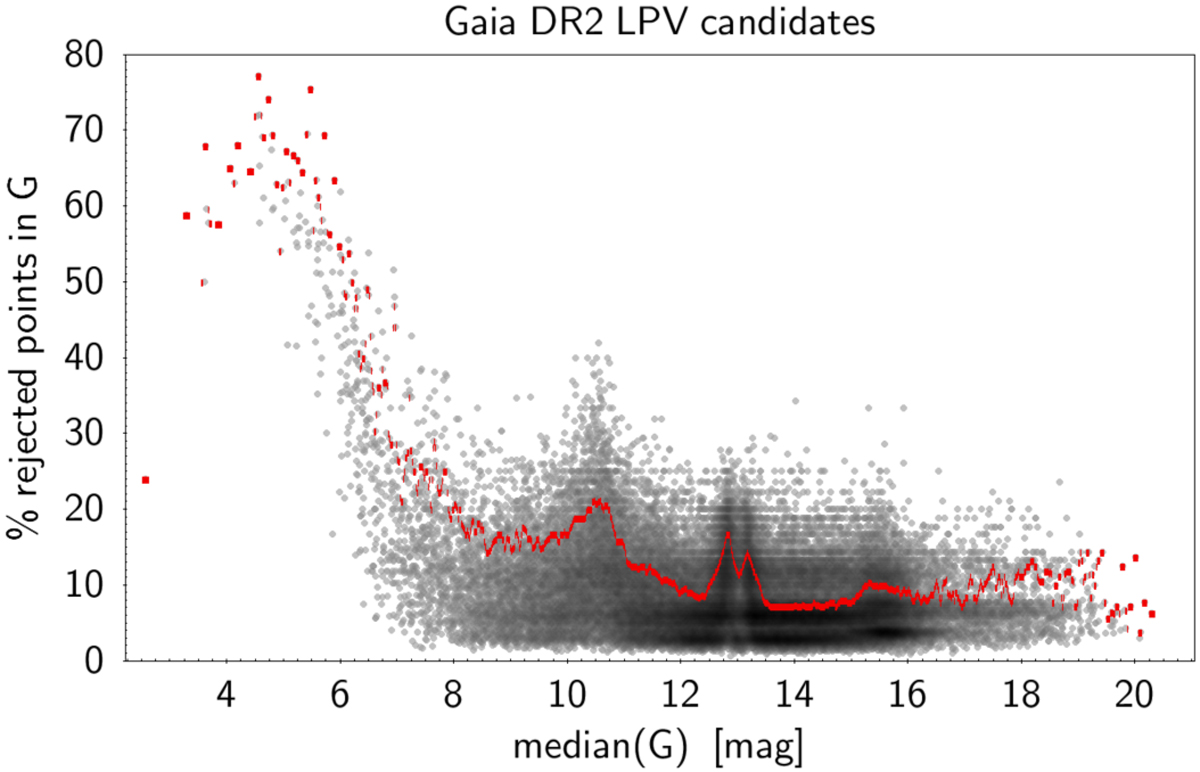
Percentage of rejected points in G -band versus median G magnitude of all Gaia DR2 LPV candidates. The red markers locate the 90% quantile of the distribution at any given magnitude.
Current usage metrics show cumulative count of Article Views (full-text article views including HTML views, PDF and ePub downloads, according to the available data) and Abstracts Views on Vision4Press platform.
Data correspond to usage on the plateform after 2015. The current usage metrics is available 48-96 hours after online publication and is updated daily on week days.
Initial download of the metrics may take a while.