Fig. 1
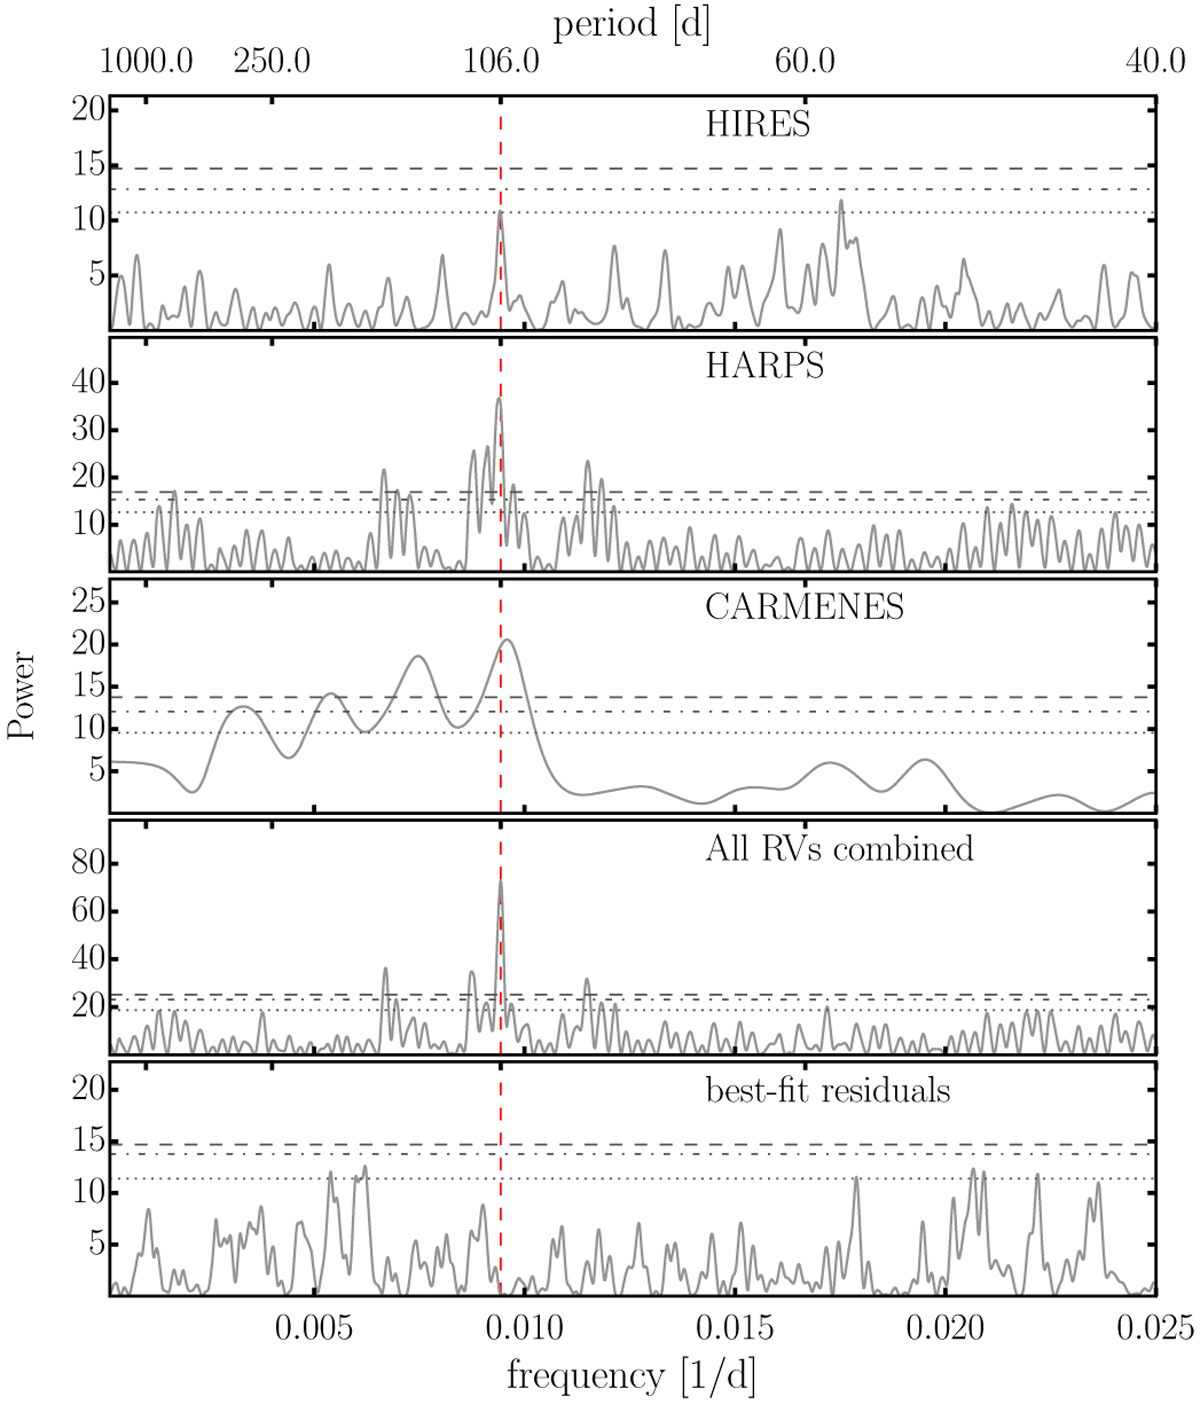
GLS periodograms of the RV data for HD 180617. Upper three panels: individual instruments, followed by the combined data set. Lowermost panel: periodogram of the residuals of the best-fit solution. The horizontal lines (dotted, dash-dotted, and dashed) illustrate FAP levels of 10, 1, and 0.1%. The best-fit period at Pb = 105.9 d is highlighted by the vertical red line.
Current usage metrics show cumulative count of Article Views (full-text article views including HTML views, PDF and ePub downloads, according to the available data) and Abstracts Views on Vision4Press platform.
Data correspond to usage on the plateform after 2015. The current usage metrics is available 48-96 hours after online publication and is updated daily on week days.
Initial download of the metrics may take a while.