Free Access
Fig. 9.
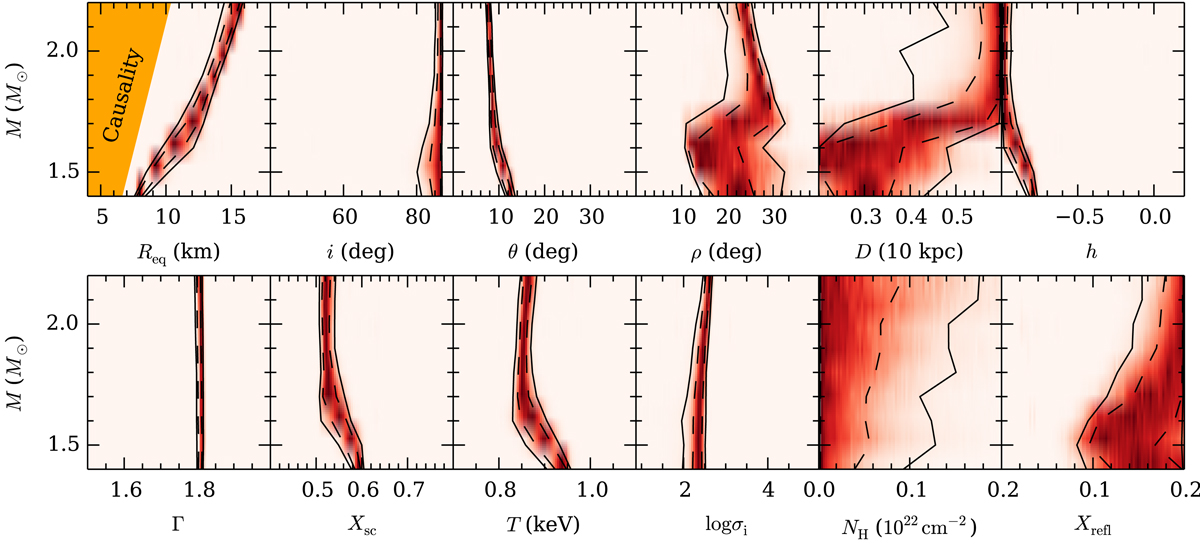
Posterior probability distributions for the MCMC runs with SAX J1808.4−3658 data, where a fixed mass grid has been used. One-dimensional posterior histograms are presented at the top of each other to make approximate two-dimensional histograms with respect to mass. The colours and contours are the same as in Fig. 2.
Current usage metrics show cumulative count of Article Views (full-text article views including HTML views, PDF and ePub downloads, according to the available data) and Abstracts Views on Vision4Press platform.
Data correspond to usage on the plateform after 2015. The current usage metrics is available 48-96 hours after online publication and is updated daily on week days.
Initial download of the metrics may take a while.