Fig. 3.
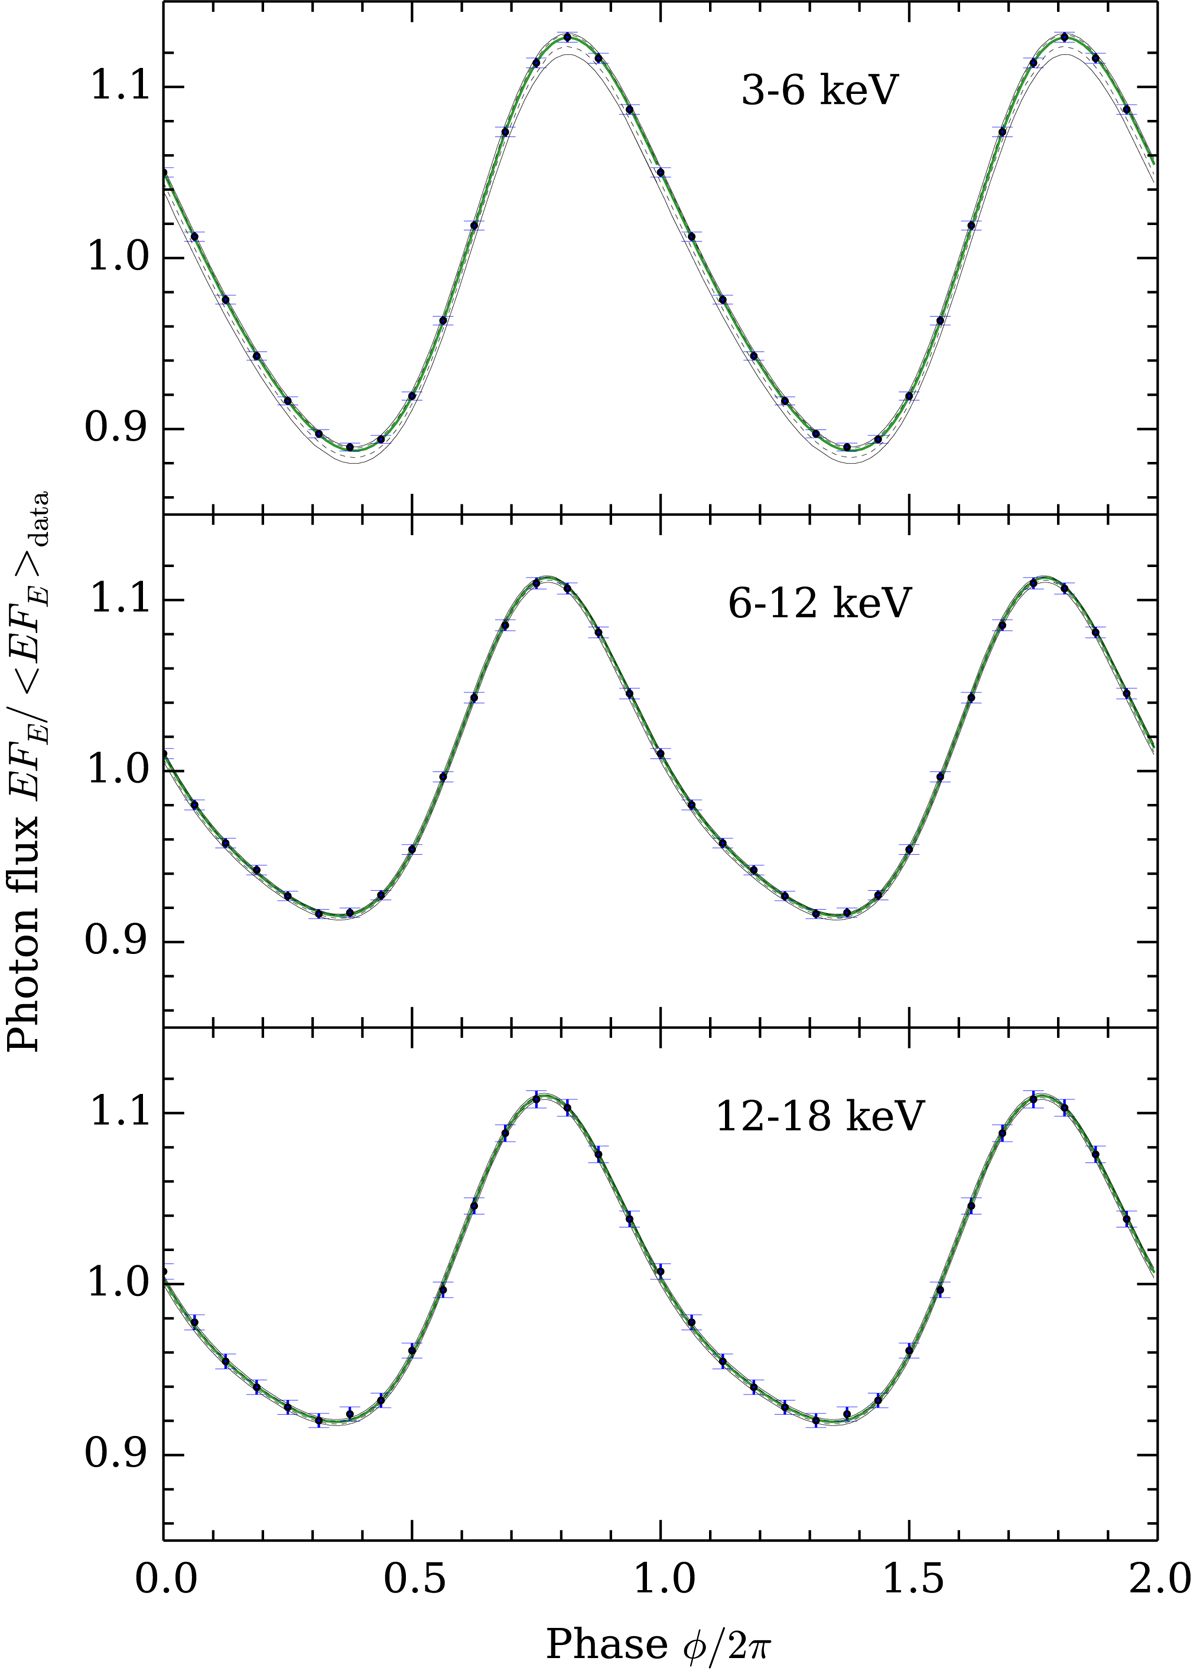
Normalized pulse profiles integrated to 3 energy bins for the synthetic data. The solid black contour shows a 95% and the dashed black contour a 68% highest posterior density credible region. The green solid line shows the best-fit solution. The observed data converted to the physical units using the best-fit model are shown with blue circles with the error bars according to the Poisson noise. The 0.5% calibration error of the detector, used in the fitting procedure, is not included to the error bars.
Current usage metrics show cumulative count of Article Views (full-text article views including HTML views, PDF and ePub downloads, according to the available data) and Abstracts Views on Vision4Press platform.
Data correspond to usage on the plateform after 2015. The current usage metrics is available 48-96 hours after online publication and is updated daily on week days.
Initial download of the metrics may take a while.