Fig. 2.
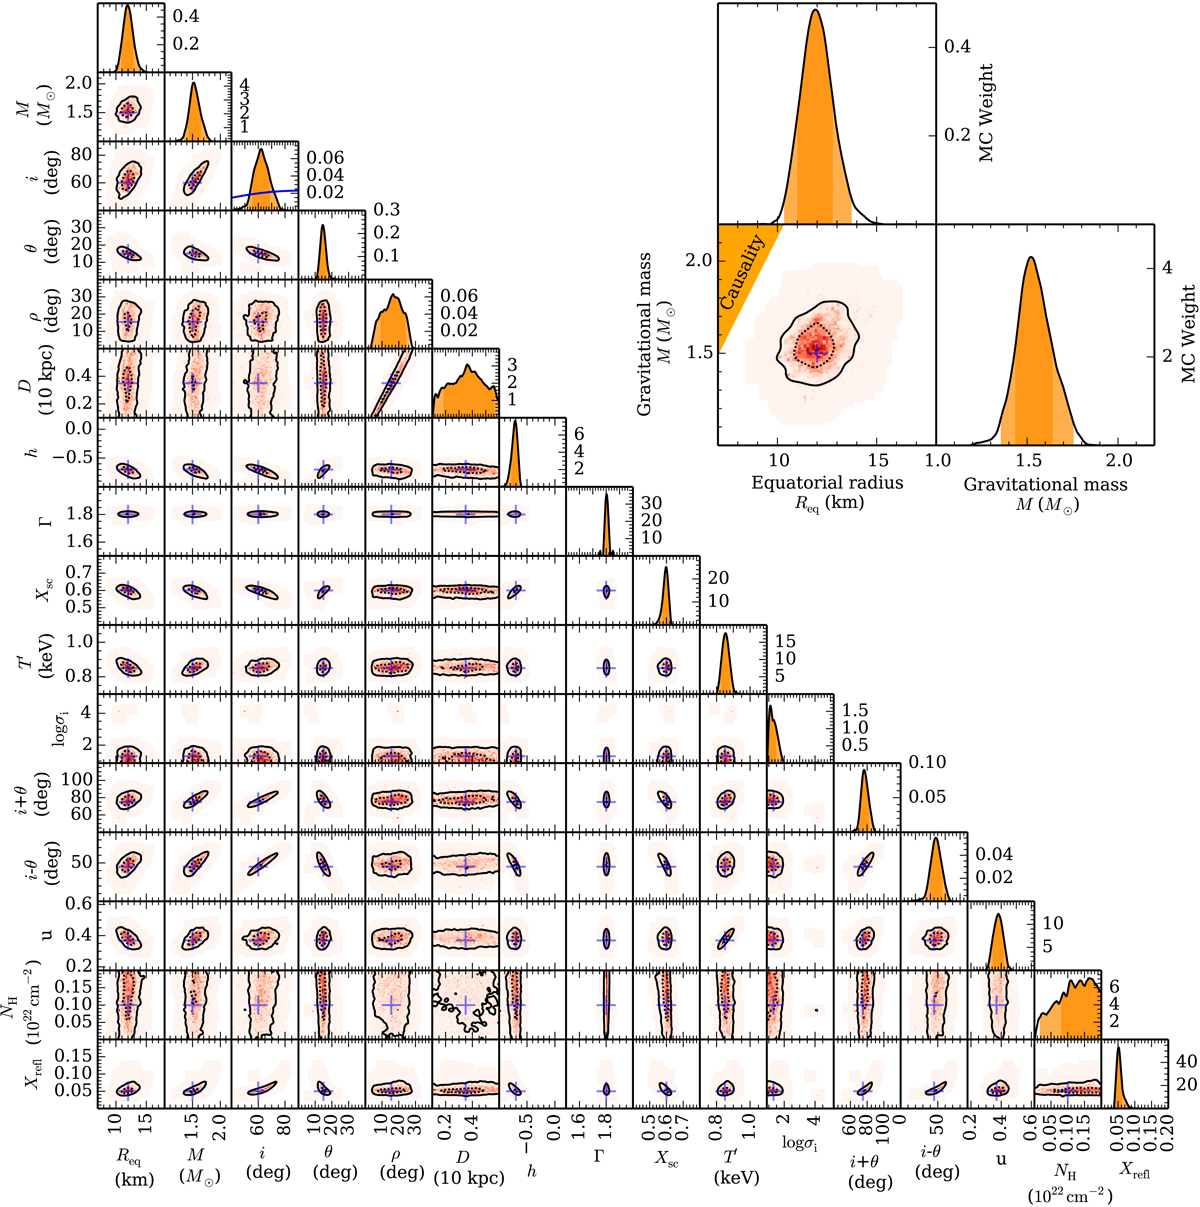
Posterior probability distributions for the MCMC runs with the synthetic data. The dark orange colour shows a 68% and the light orange colour a 95% highest posterior density credible interval. In the 2D posterior distributions the solid contour shows a 95% and the dashed contour a 68% highest posterior density credible region. The blue crosses show the correct solution. The sin i prior in i is shown with a blue line. The compactness parameter u is defined here as u ≡ rS/Req. The inset in the upper right corner shows the mass–radius posterior distribution in more detail.
Current usage metrics show cumulative count of Article Views (full-text article views including HTML views, PDF and ePub downloads, according to the available data) and Abstracts Views on Vision4Press platform.
Data correspond to usage on the plateform after 2015. The current usage metrics is available 48-96 hours after online publication and is updated daily on week days.
Initial download of the metrics may take a while.