Open Access
Fig. 3
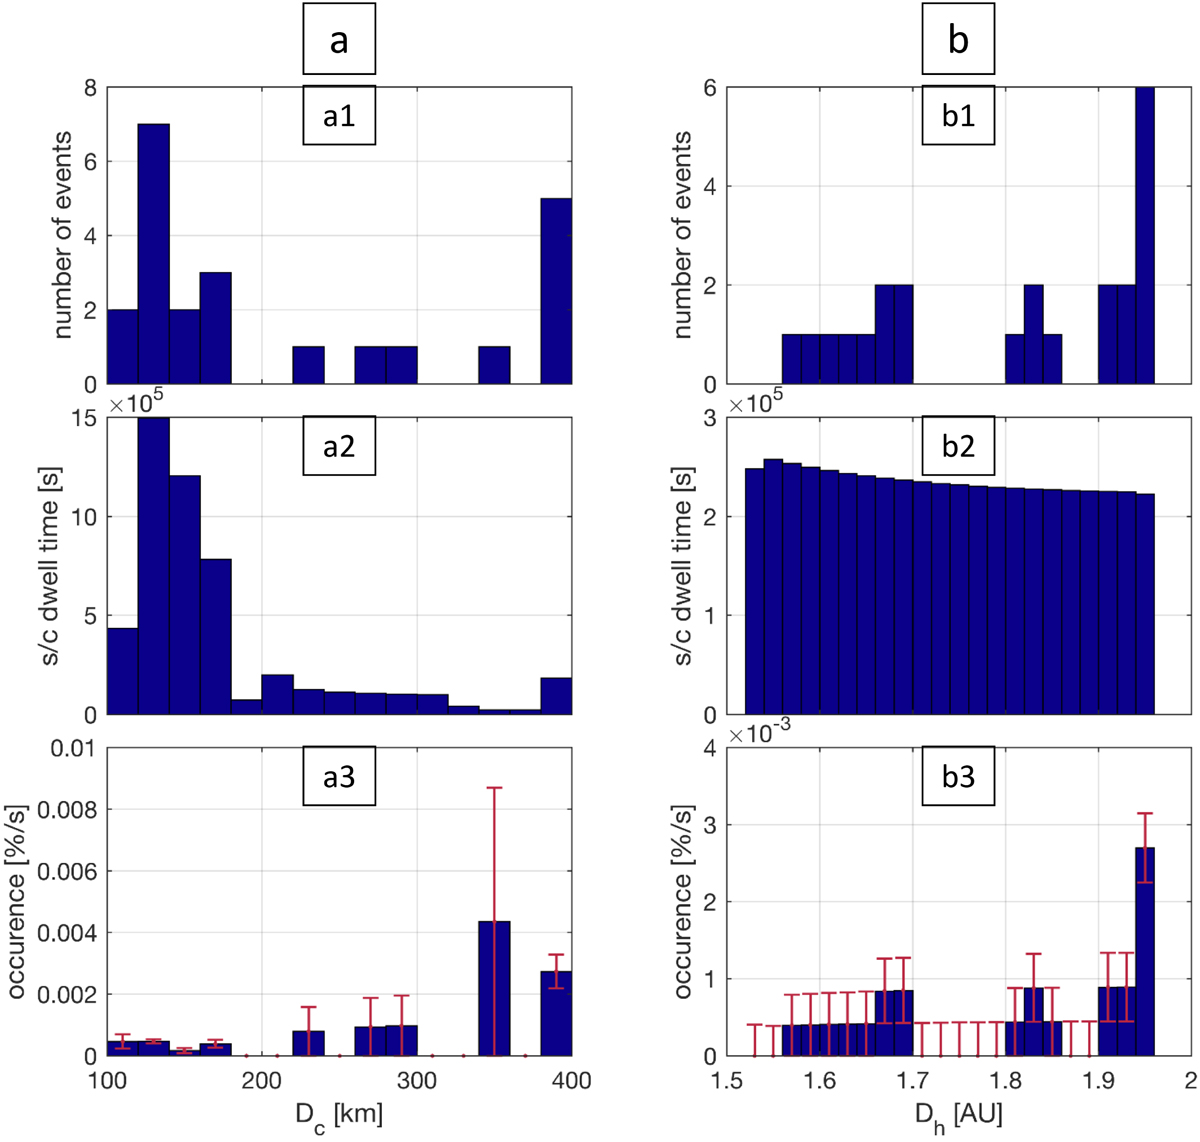
Occurrence of events as a function of distance to the comet Dc(a) and distanceto the Sun Dh(b).From top tobottom panels: show number of events (1), dwell time of Rosetta (2), and normalized occurrence of events (3). Error bars show the one count errors.
Current usage metrics show cumulative count of Article Views (full-text article views including HTML views, PDF and ePub downloads, according to the available data) and Abstracts Views on Vision4Press platform.
Data correspond to usage on the plateform after 2015. The current usage metrics is available 48-96 hours after online publication and is updated daily on week days.
Initial download of the metrics may take a while.