Free Access
Fig. 9.
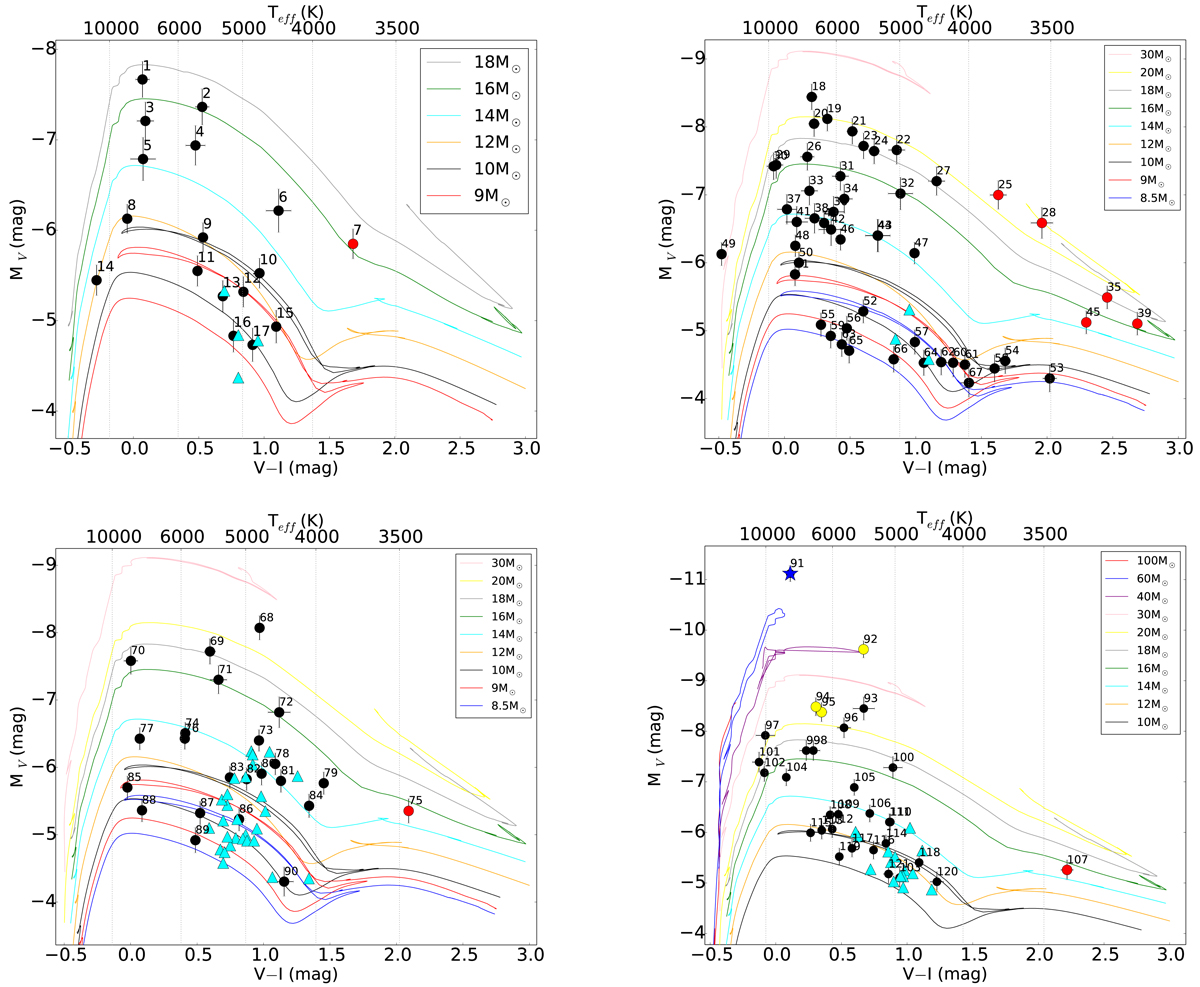
Color-magnitude diagrams per chip with MESA evolutionary models over-plotted. The two upper panels correspond to variables in chips PC and WF2 while the lower panels to those in chips WF3 and WF4.
Current usage metrics show cumulative count of Article Views (full-text article views including HTML views, PDF and ePub downloads, according to the available data) and Abstracts Views on Vision4Press platform.
Data correspond to usage on the plateform after 2015. The current usage metrics is available 48-96 hours after online publication and is updated daily on week days.
Initial download of the metrics may take a while.