Free Access
Fig. 8.
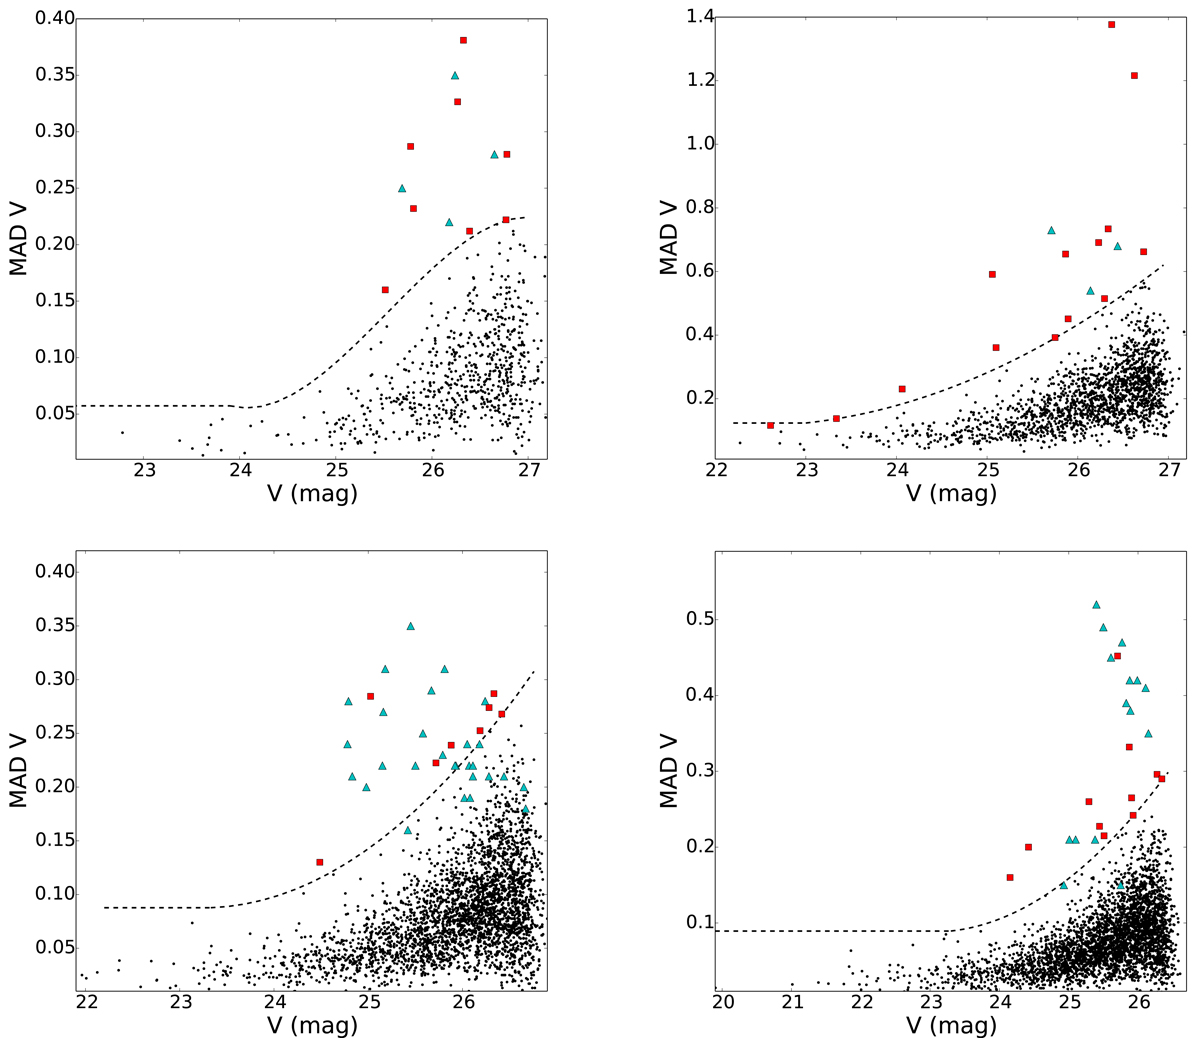
Mean absolute deviation versus mean magnitude. The dashed line shows the stars over the 4σ threshold. The variable candidates are shown in red squares and the known variables are shown in blue triangles. The four panels per column correspond to the chips PC, WF2, WF3, and WF4 respectively.
Current usage metrics show cumulative count of Article Views (full-text article views including HTML views, PDF and ePub downloads, according to the available data) and Abstracts Views on Vision4Press platform.
Data correspond to usage on the plateform after 2015. The current usage metrics is available 48-96 hours after online publication and is updated daily on week days.
Initial download of the metrics may take a while.