Fig. 6.
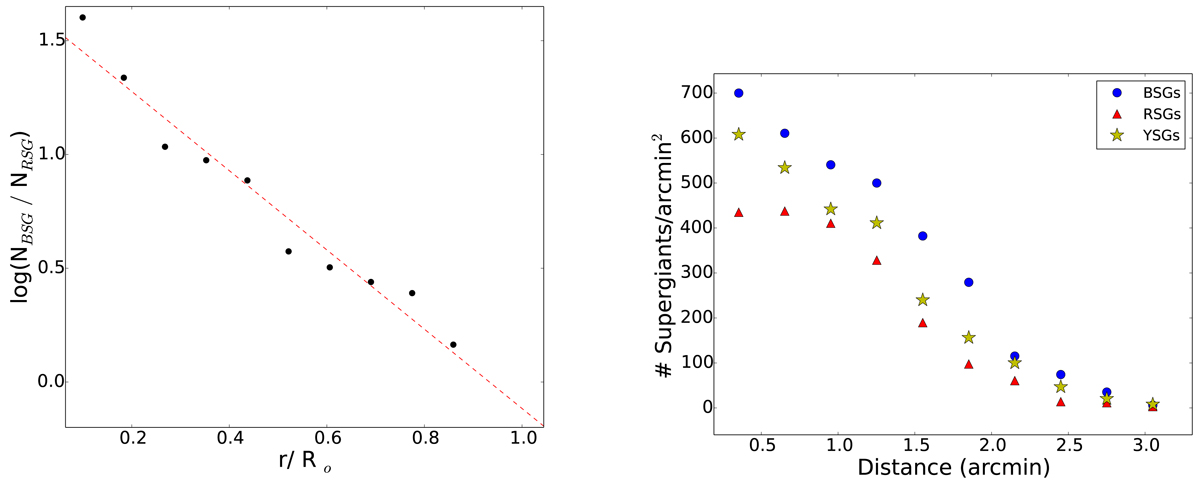
Left panel: blue to red supergiant ratio for NGC 4535. The dashed red line is a linear fit indicating the monotonic radial decline of the blue to red supergiants. Right panel: number of candidate BSGs, RSGs, YSGs/arcmin2 versus the distance from the center. The candidate BSGs are shown as blue dots, the RSGs as red triangles, and the YSGs as yellow stars.
Current usage metrics show cumulative count of Article Views (full-text article views including HTML views, PDF and ePub downloads, according to the available data) and Abstracts Views on Vision4Press platform.
Data correspond to usage on the plateform after 2015. The current usage metrics is available 48-96 hours after online publication and is updated daily on week days.
Initial download of the metrics may take a while.