Free Access
Fig. 1.
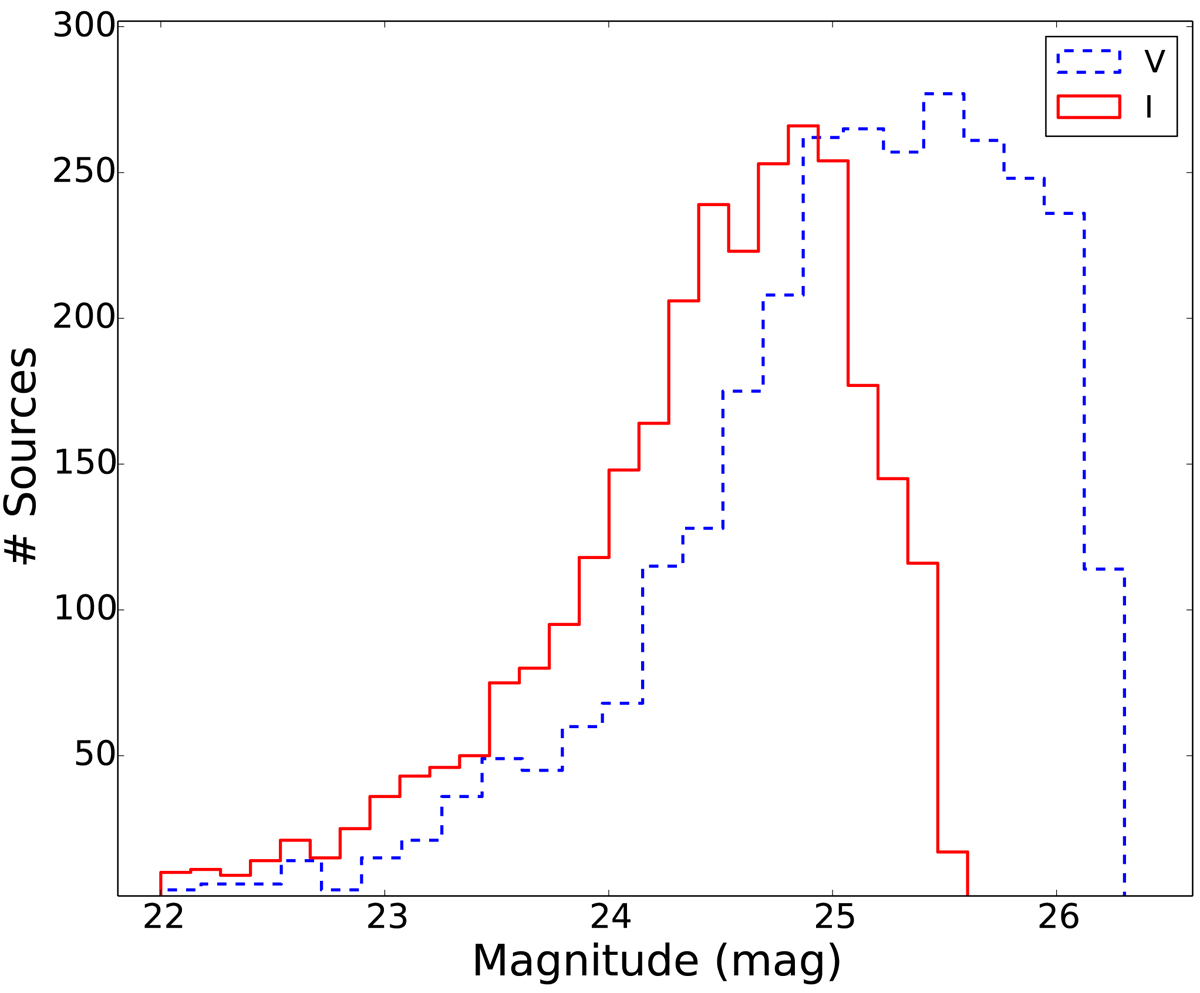
Histogram of the number of sources versus the mean magnitude for the I filter (red solid line) and the V filter (blue dashed line). The faint limits in V and I magnitude indicate the magnitude up to which our sample is 50% complete.
Current usage metrics show cumulative count of Article Views (full-text article views including HTML views, PDF and ePub downloads, according to the available data) and Abstracts Views on Vision4Press platform.
Data correspond to usage on the plateform after 2015. The current usage metrics is available 48-96 hours after online publication and is updated daily on week days.
Initial download of the metrics may take a while.