Fig. 3.
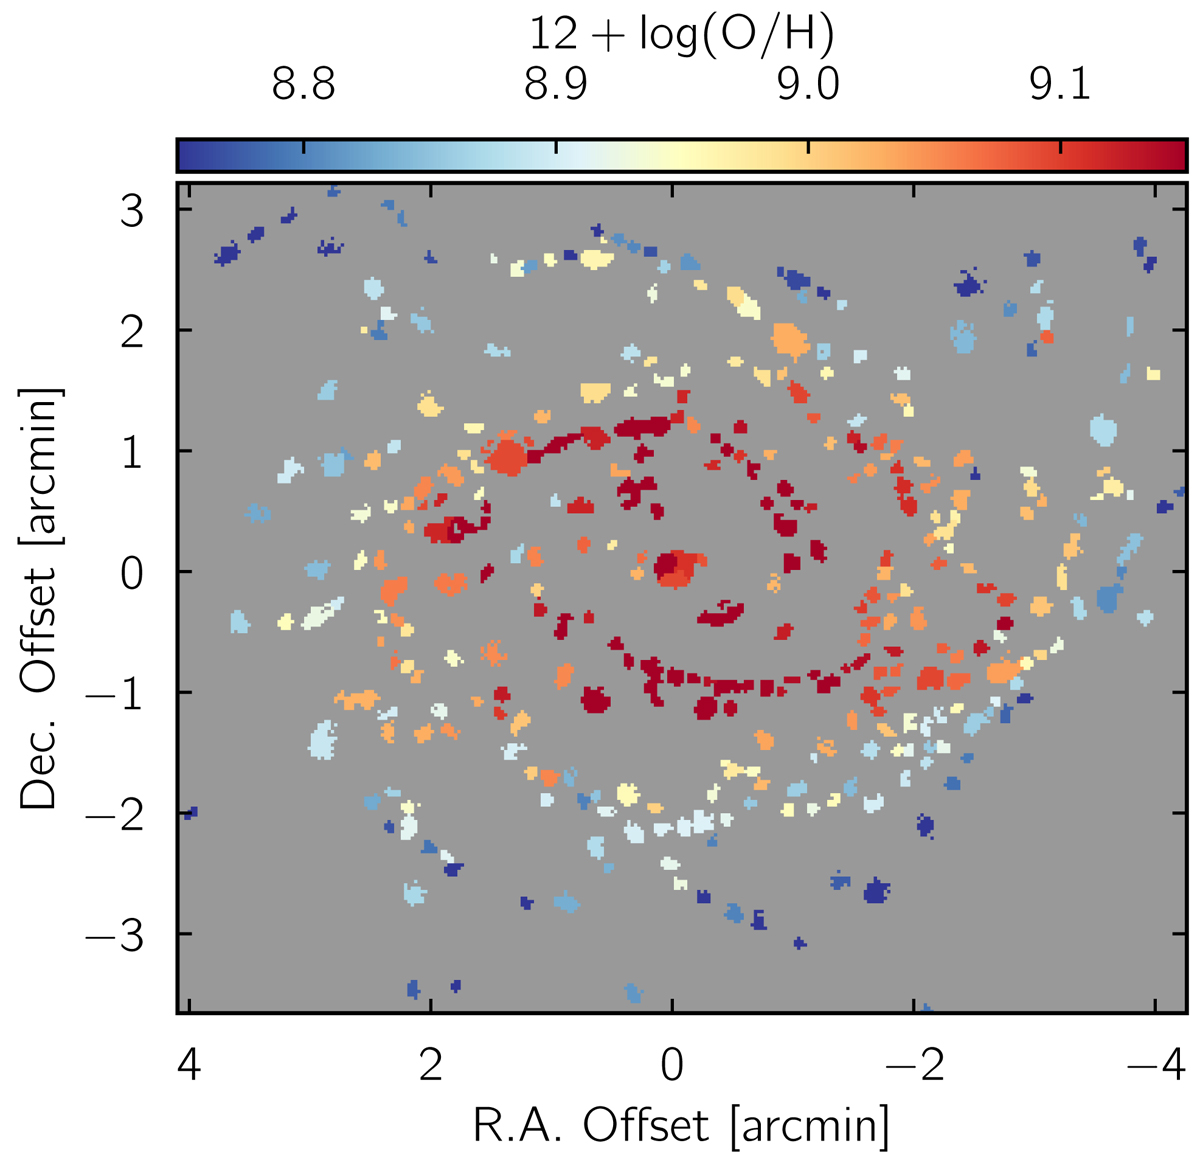
Gas-phase oxygen abundance map. Each region on the maps corresponds to one H II region identified by HIIPHOT on the Hα map and has line ratios consistent with photoionization. We note that the abundance scale here is from the D13 model. The mean oxygen abundance derived from the Te method is approximately 0.7 solar, as reported by Bresolin et al. (2005) who detected auroral lines in seven H II regions on the disk.
Current usage metrics show cumulative count of Article Views (full-text article views including HTML views, PDF and ePub downloads, according to the available data) and Abstracts Views on Vision4Press platform.
Data correspond to usage on the plateform after 2015. The current usage metrics is available 48-96 hours after online publication and is updated daily on week days.
Initial download of the metrics may take a while.