Fig. 13.
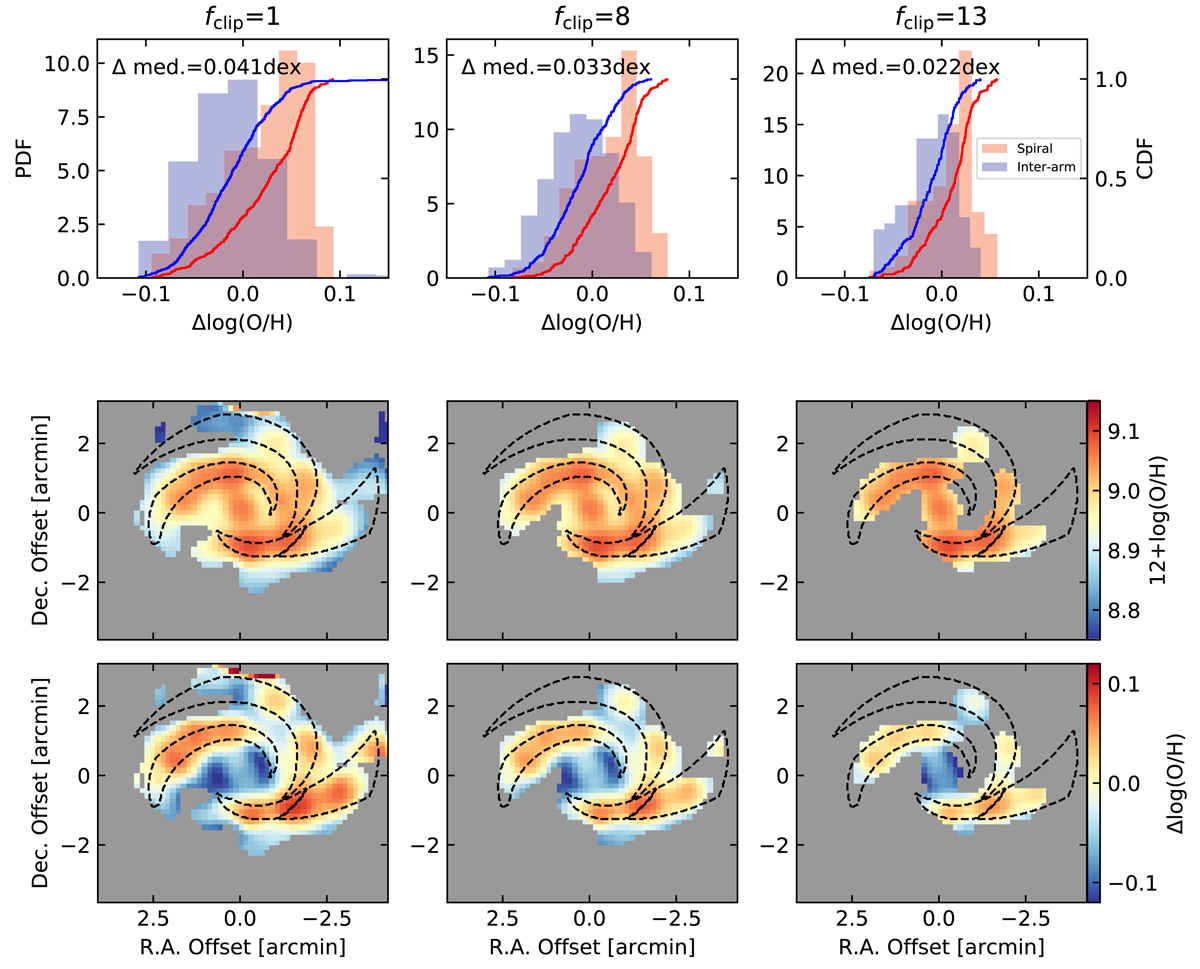
Simulation of the effect of the S/N on the observed azimuthal variations. Each column corresponds to one set of simulation using different fclip values. A higher fclip corresponds to applying a higher Hα threshold on spaxels entering the analysis, in other words, poorer S/N data. The starting point of the analysis (left column) is at 1000 pc resolution, the same as the lower bottom panel of Fig. 12. The different rows present the abundance residual distributions (top), the abundance maps (middle), and the abundance residual maps (bottom). The observed azimuthal variations decreases with increasing fclip (decreasing S/N),
Current usage metrics show cumulative count of Article Views (full-text article views including HTML views, PDF and ePub downloads, according to the available data) and Abstracts Views on Vision4Press platform.
Data correspond to usage on the plateform after 2015. The current usage metrics is available 48-96 hours after online publication and is updated daily on week days.
Initial download of the metrics may take a while.