Fig. 12.
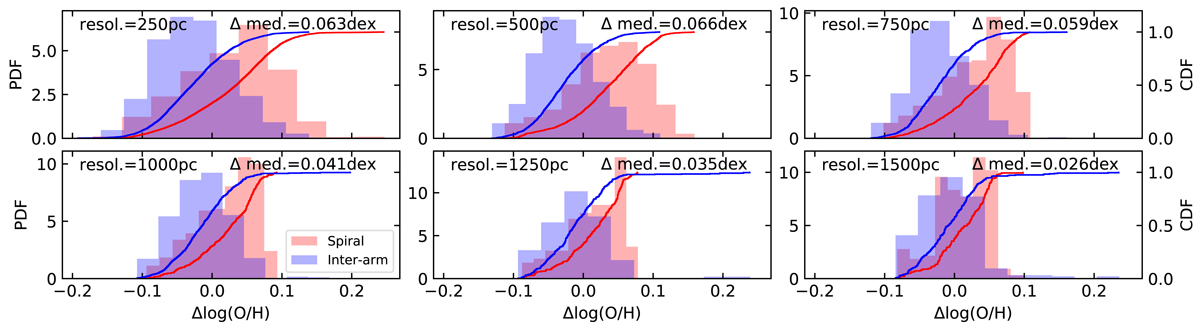
Distributions of the abundance residuals, Δlog(O/H), for the spiral and inter-arm spaxels (red and blue, respectively). Different panels correspond to convolving the TYPHOON cube to different spatial resolutions, as labeled in the upper left corner of each panel. Both histograms and the cumulative distribution functions are shown. The difference between the medians is labeled in the upper right corner of each panel.
Current usage metrics show cumulative count of Article Views (full-text article views including HTML views, PDF and ePub downloads, according to the available data) and Abstracts Views on Vision4Press platform.
Data correspond to usage on the plateform after 2015. The current usage metrics is available 48-96 hours after online publication and is updated daily on week days.
Initial download of the metrics may take a while.