Fig. 11.
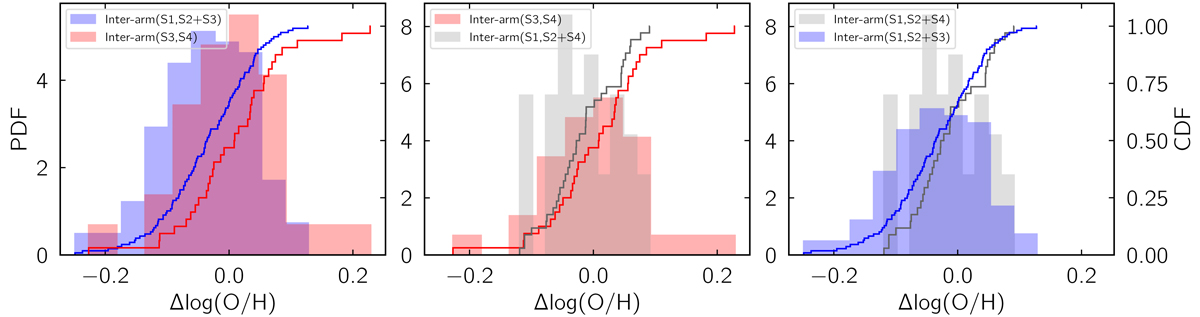
Distributions of abundance residuals, Δlog(O/H), for different inter-arm regions. The four spiral structures defined in Figs. 4 and 5 divide the galactic disk into three inter-arm regions. Each of the three panels compares two of the three inter-arm regions. “Inter-arm(S1, S2 + S3)” denotes the inter-arm region between the S1 and S2 + S3 spiral regions. Both histograms (left y-axis) and cumulative distribution functions (right y-axis) are shown. Under the null hypothesis that the two distributions have the same mean, the p-values derived from bootstrap are tabulated in Table 4.
Current usage metrics show cumulative count of Article Views (full-text article views including HTML views, PDF and ePub downloads, according to the available data) and Abstracts Views on Vision4Press platform.
Data correspond to usage on the plateform after 2015. The current usage metrics is available 48-96 hours after online publication and is updated daily on week days.
Initial download of the metrics may take a while.