Fig. 10.
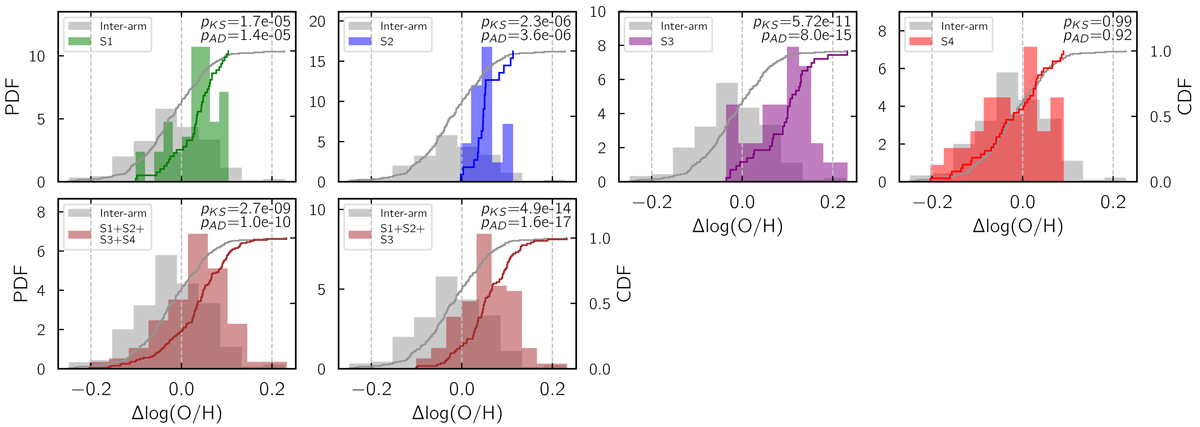
Distributions of abundance residuals (Δlog(O/H); best-fit linear gradient subtracted). The histograms correspond to the left-hand-side vertical axes (probability distribution function (PDF)), and the curves correspond to the right-hand-side vertical axes (cumulative distribution function (CDF)). The top row compares the inter-arm H II regions with those in the four different spiral arm structures – S1–S4. The bottom row compares the inter-arm H II regions with S1 + S2 + S3 + S4 (all spiral arm structures; first panel from the left) and S1 + S2 + S3 (without S4; second panel from the left). The p-values from two-sided Kolmogorov–Smirnov and Anderson–Darling tests are labeled in each panel (pKS and pAD). Details are discussed in Sect. 4.2.
Current usage metrics show cumulative count of Article Views (full-text article views including HTML views, PDF and ePub downloads, according to the available data) and Abstracts Views on Vision4Press platform.
Data correspond to usage on the plateform after 2015. The current usage metrics is available 48-96 hours after online publication and is updated daily on week days.
Initial download of the metrics may take a while.