Fig. 1.
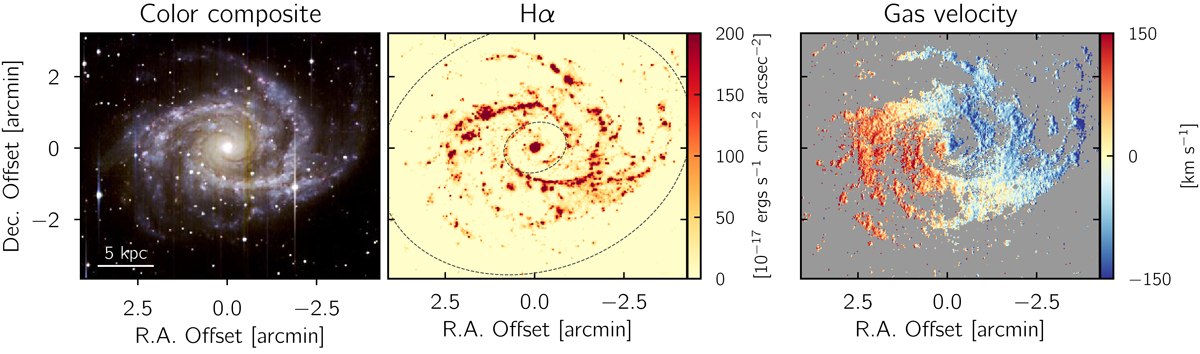
Left: BVR color-composite image of NGC 2997 reconstructed from the data cube. Middle: Hα map derived from fitting the emission line. The two dashed ellipses correspond to 0.2× and 1 × R25 in the frame of the galactic disk. This work focuses on H II regions falling in between the two ellipses. Right: ionized gas velocity field measured from fitting emission lines. North is to the top and east to the left.
Current usage metrics show cumulative count of Article Views (full-text article views including HTML views, PDF and ePub downloads, according to the available data) and Abstracts Views on Vision4Press platform.
Data correspond to usage on the plateform after 2015. The current usage metrics is available 48-96 hours after online publication and is updated daily on week days.
Initial download of the metrics may take a while.