Fig. 3.
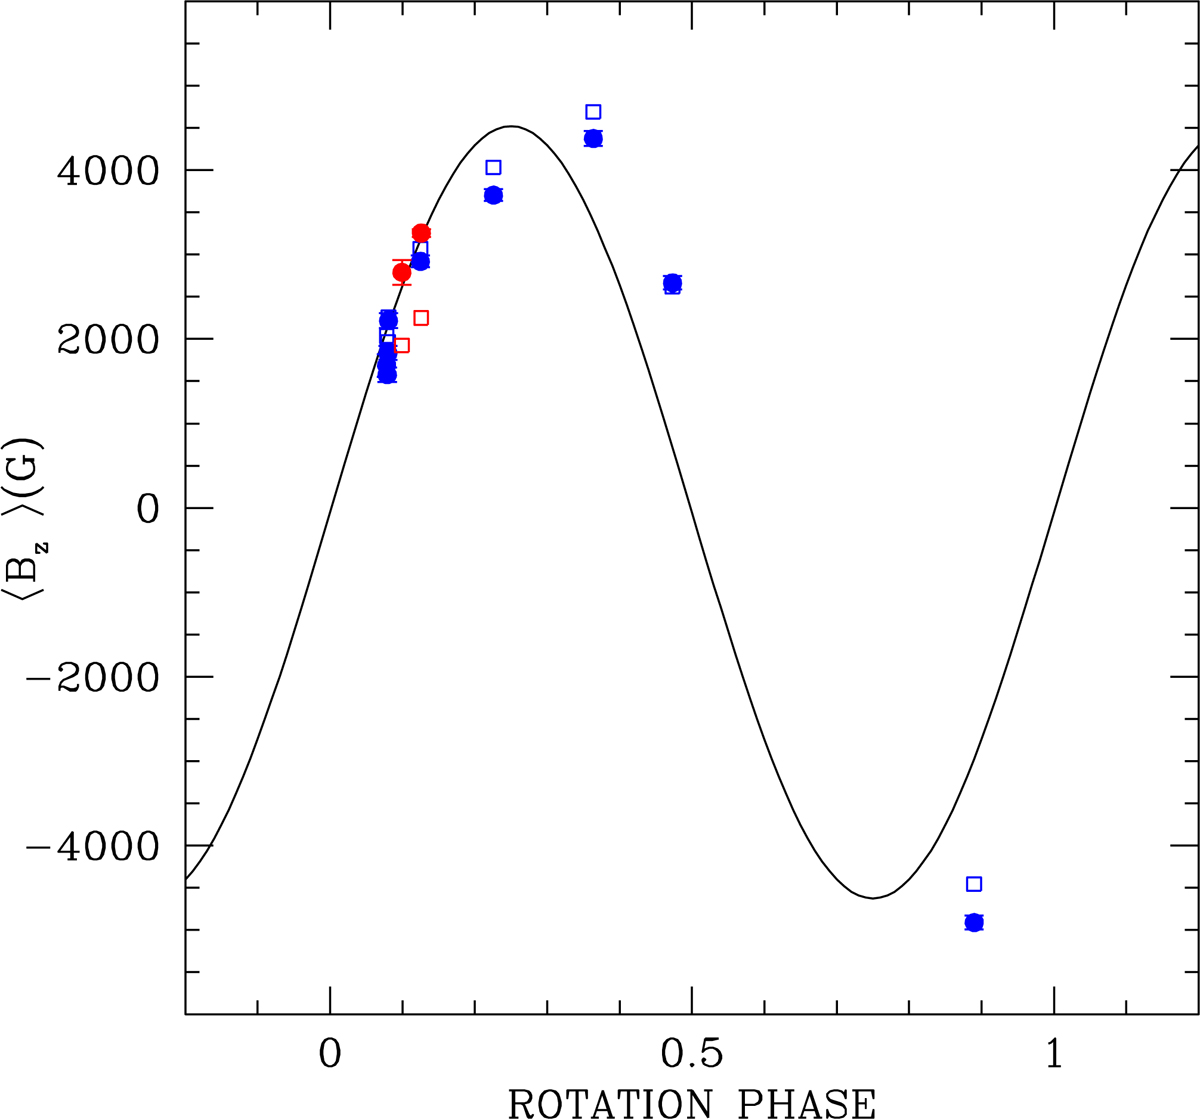
Comparison of our ISIS measurements of reference star 53 Cam = HD 65339 with the sinusoidal curve obtained by Hill et al. (1998). Filled circles refer to measurements obtained from metal lines, and empty squares to field measurements from H Balmer lines. Blue symbols refer to data obtained with grating R600B, and red symbols to data obtained with the R1200R grating. Error bars are shown only for the measurements obtained from H Balmer lines; their size is comparable to the symbol size.
Current usage metrics show cumulative count of Article Views (full-text article views including HTML views, PDF and ePub downloads, according to the available data) and Abstracts Views on Vision4Press platform.
Data correspond to usage on the plateform after 2015. The current usage metrics is available 48-96 hours after online publication and is updated daily on week days.
Initial download of the metrics may take a while.