Fig. 2.
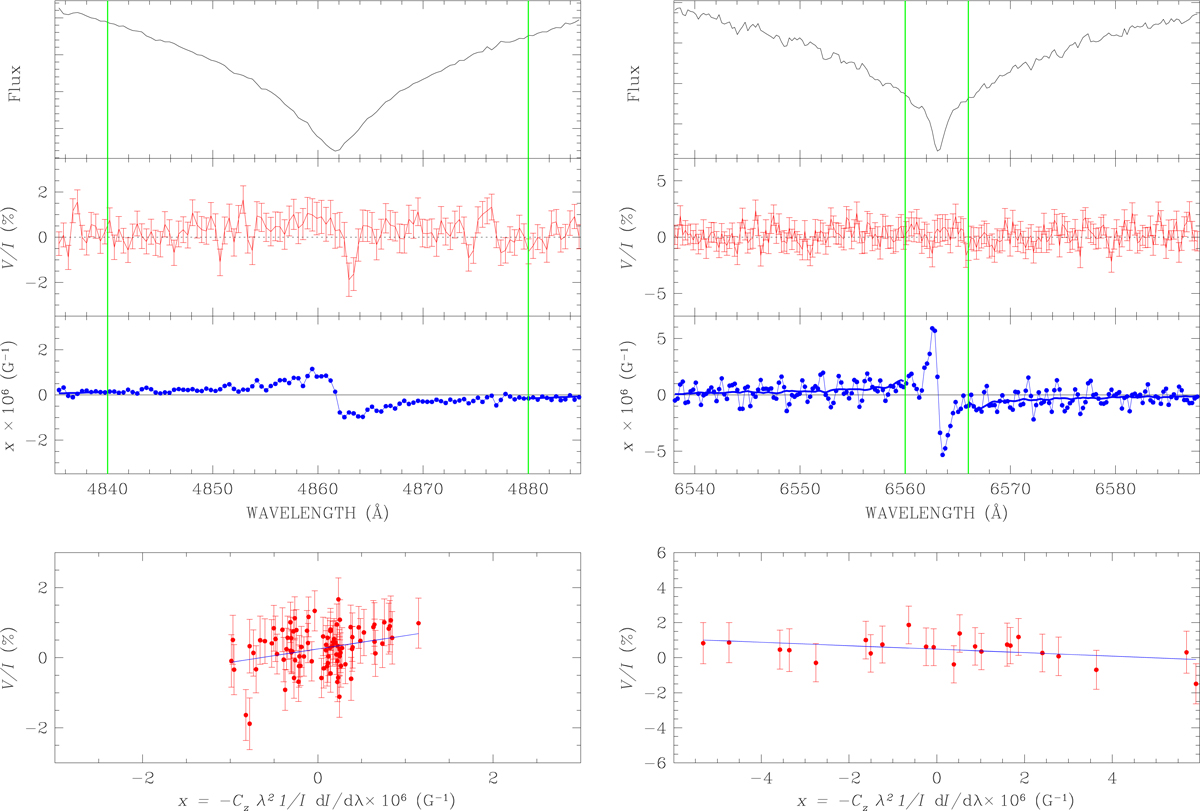
Hβ (left panel) and Hα (right panel) lines of star WD 1840−111 observed with ISIS in the blue and red arm, respectively. Top panel: I profile (in arbitrary units). Second panel from top: V/I profile. Third panel from top: x = −Cz λ2(1/I)dI/dλ vs. wavelength. The green vertical lines show the wavelength intervals in which the x values clearly depart from zero, and which have been choosen to apply the least-square technique. Bottom panel: relation between V/I and x for the points within the solid green lines in the upper panels. Note that the x and V/I ranges of the Hβ plots are half the size of the corresponing ranges in the Hα plots.
Current usage metrics show cumulative count of Article Views (full-text article views including HTML views, PDF and ePub downloads, according to the available data) and Abstracts Views on Vision4Press platform.
Data correspond to usage on the plateform after 2015. The current usage metrics is available 48-96 hours after online publication and is updated daily on week days.
Initial download of the metrics may take a while.