Fig. 1.
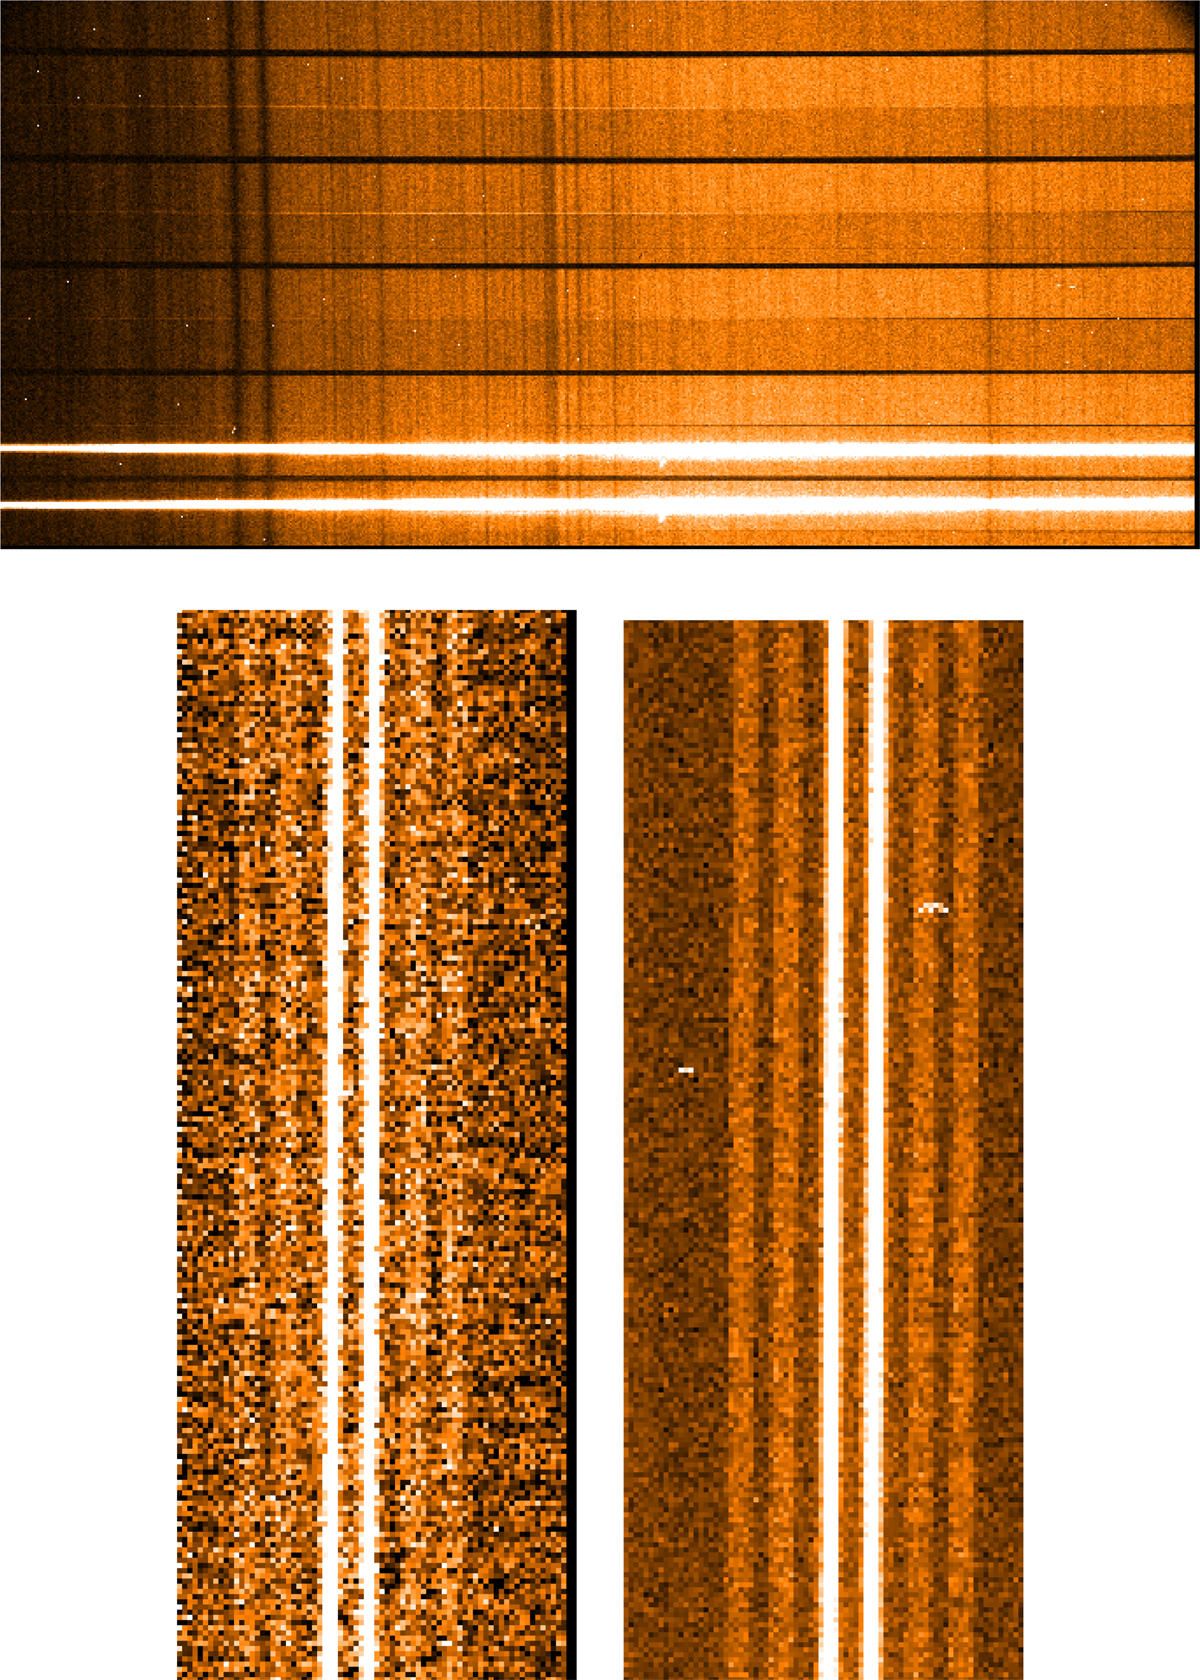
Raw image of spectropolarimetric data obtained with FORS2 (top panel), ISIS blue CCD (bottom left panel) and ISIS red CCD (bottom right panel). For all images, the dynamic range is set to show the sky background, which is at the level of a few hundred ADUs (while the spectra are at the level of several thousand ADUs). The FORS2 image refers to WD 2039−202 observed on 2015-06-02. The ISIS image refers to WD 2111+498 observed on 2015-08-30. For display purpose, the images of the ISIS spectra have been trimmed in the dispersion direction. Note in ISIS images the four strips illuminated by sky background.
Current usage metrics show cumulative count of Article Views (full-text article views including HTML views, PDF and ePub downloads, according to the available data) and Abstracts Views on Vision4Press platform.
Data correspond to usage on the plateform after 2015. The current usage metrics is available 48-96 hours after online publication and is updated daily on week days.
Initial download of the metrics may take a while.