Fig. 6.
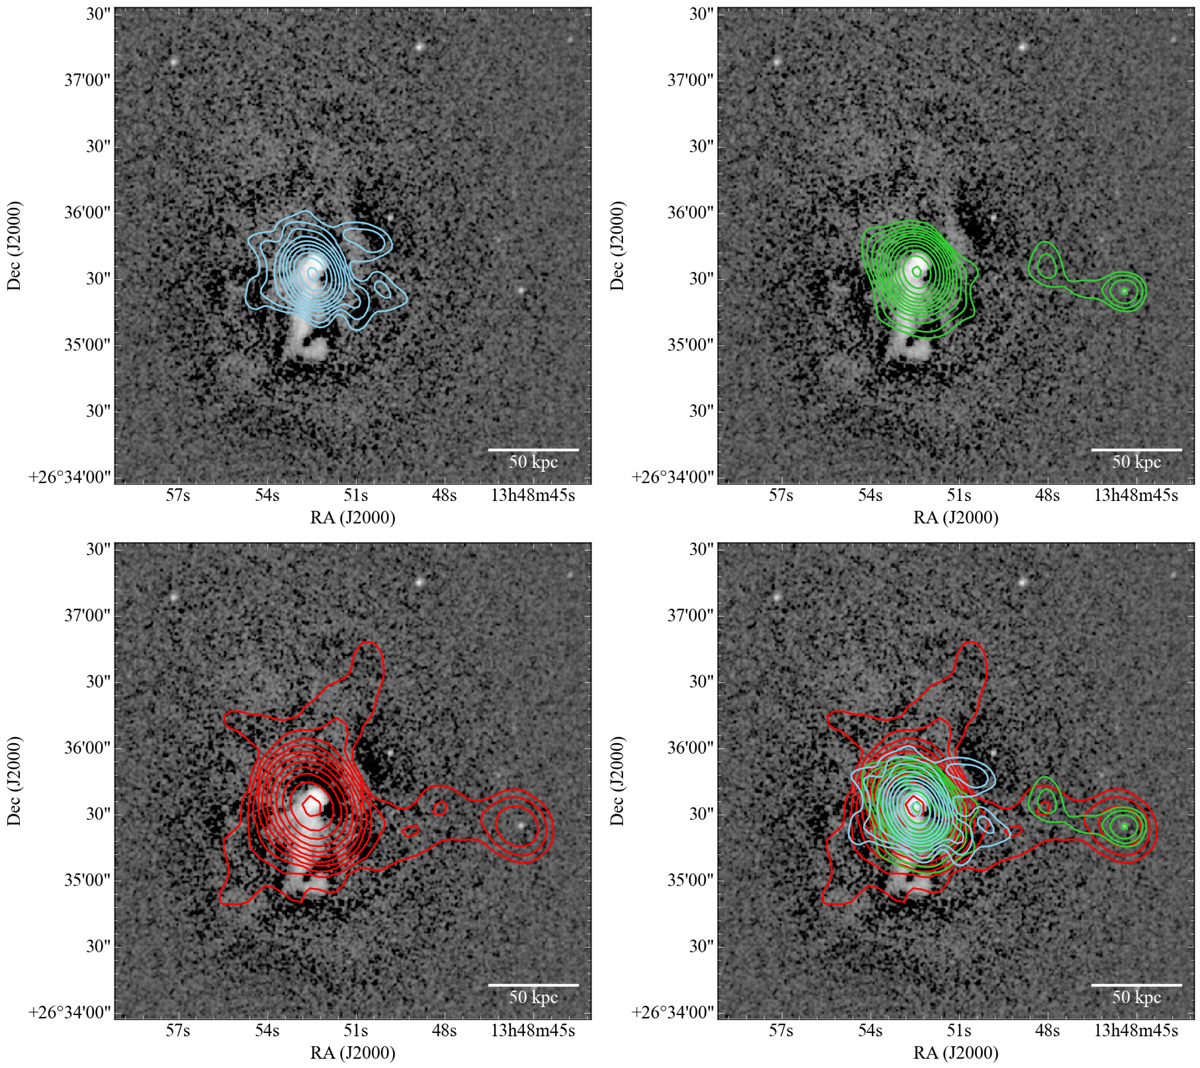
X-ray residual map of A1795 with radio contours from different radio frequencies. Top left: contours from the GMRT image at 235 MHz. Top right: contours from the GMRT image at 610 MHz. The contour levels at 610 and 235 MHz are the same as in Fig. 3. Bottom left: contours at 1.4 GHz derived from the VLA C-configuration image of Giacintucci et al. (2014) are shown in red. They are drawn at 5σ × [1, 2, 4, 8, 16, 32, 64, 128, 256, 512, 1024, 2048], where the rms noise level is 0.15 mJy beam−1. Bottom right: composite depicting the radio contours at 1.4 GHz C-configuration (red), 610 MHz (green), and 235 MHz (blue).
Current usage metrics show cumulative count of Article Views (full-text article views including HTML views, PDF and ePub downloads, according to the available data) and Abstracts Views on Vision4Press platform.
Data correspond to usage on the plateform after 2015. The current usage metrics is available 48-96 hours after online publication and is updated daily on week days.
Initial download of the metrics may take a while.