Free Access
Fig. 5.
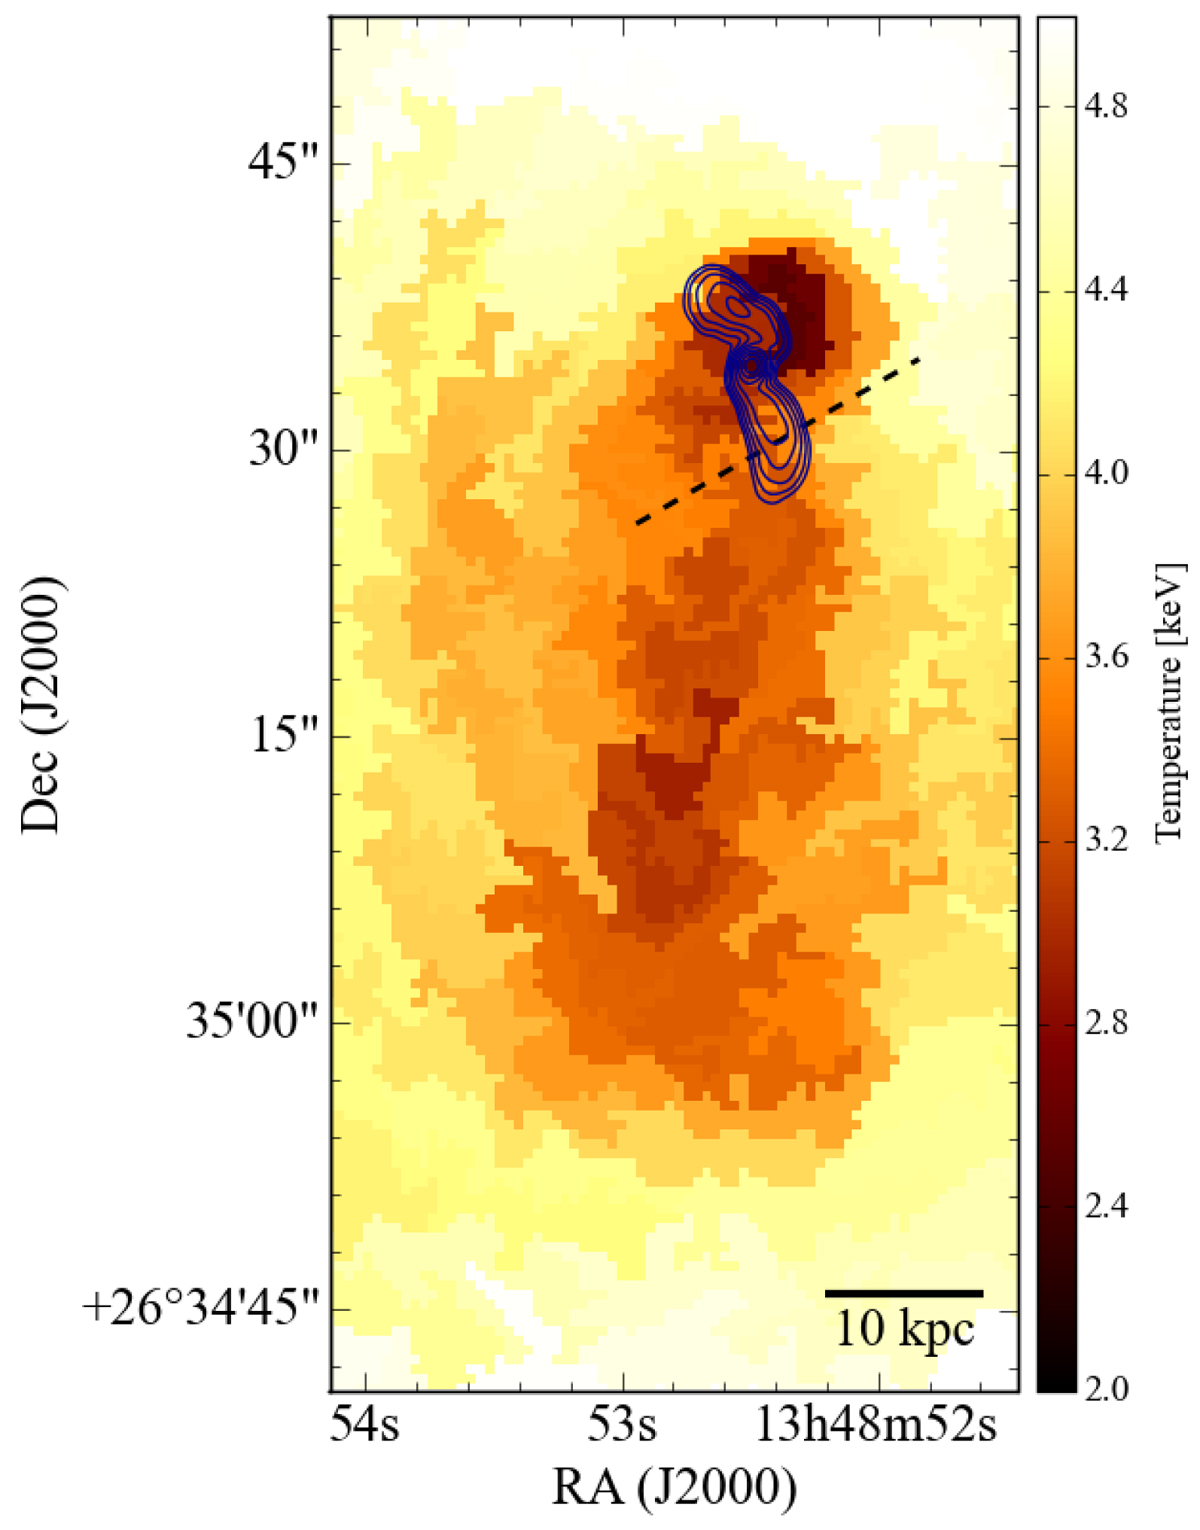
Temperature map of the cold tail with radio contours at 1.4 GHz from the VLA in A-configuration from Bîrzan et al. (2008). Contours are drawn at 10 mJy beam−1 × [1,1.4,2,2.8,4,5.7,8,11]. The black dashed line indicates the division between the inner and outer tail, as defined in Sect. 6.
Current usage metrics show cumulative count of Article Views (full-text article views including HTML views, PDF and ePub downloads, according to the available data) and Abstracts Views on Vision4Press platform.
Data correspond to usage on the plateform after 2015. The current usage metrics is available 48-96 hours after online publication and is updated daily on week days.
Initial download of the metrics may take a while.