Free Access
Fig. 4.
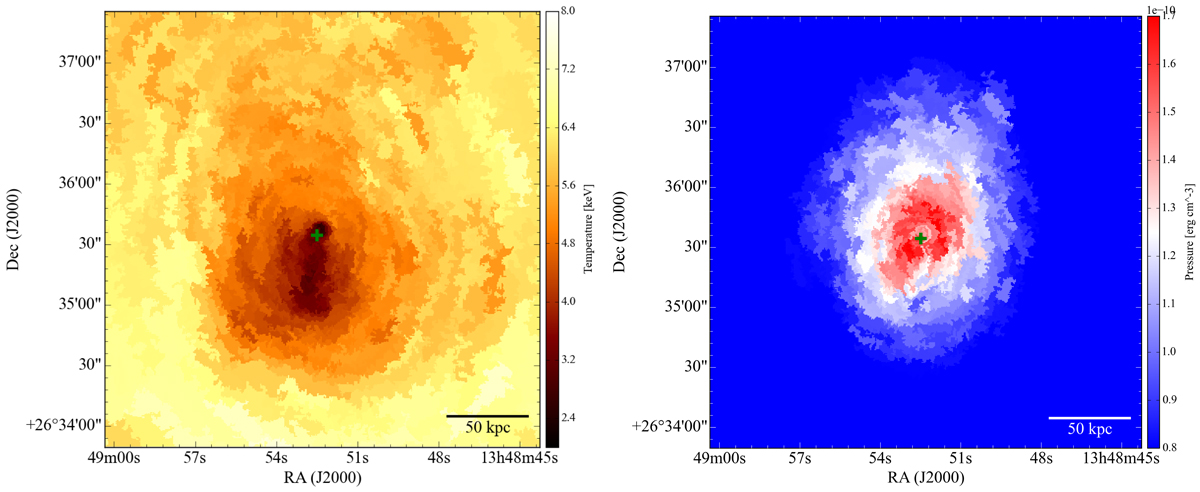
Temperature (left) and pressure (right) maps of the core of A1795 within a radius of 130 kpc from the AGN. Both maps are derived from Chandra imaging X-ray spectroscopy using regions with a S/N of 100, as described in Sect. 2.1. The cross indicates the center of the radio source.
Current usage metrics show cumulative count of Article Views (full-text article views including HTML views, PDF and ePub downloads, according to the available data) and Abstracts Views on Vision4Press platform.
Data correspond to usage on the plateform after 2015. The current usage metrics is available 48-96 hours after online publication and is updated daily on week days.
Initial download of the metrics may take a while.