Fig. 12.
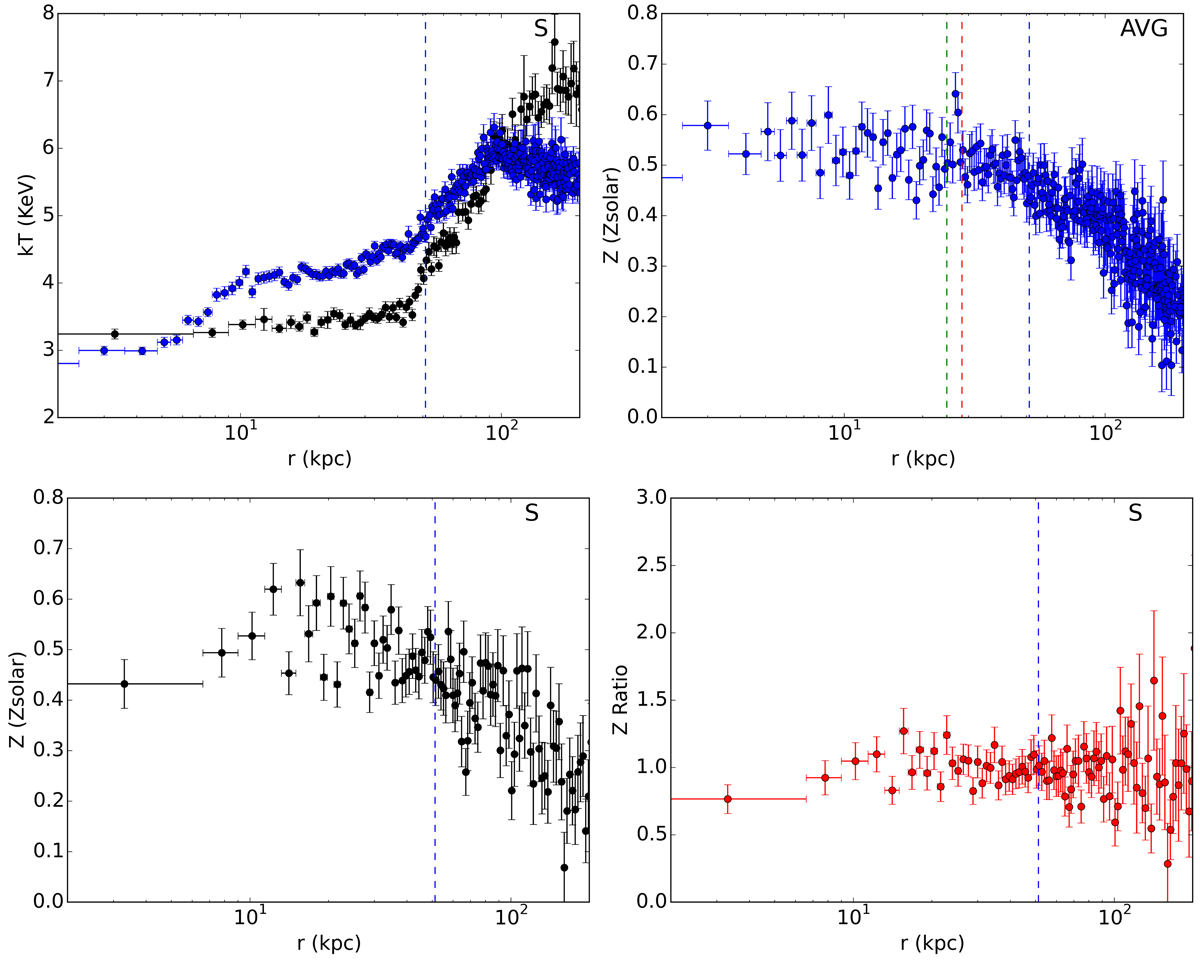
Top left: temperature radial profile along the $S$ direction (black) and average temperature profile (blue). Top right: average metallicity profile. Bottom left: metallicity profile along the S. Bottom right: ratio of the metallicity profile toward the S to the average metallicity profile. The vertical blue line indicates the end of the tail as determined from the X-ray residual map (Fig. 7). The red and green vertical lines in the average metallicity plot indicate the position of the NW and SW edges, respectively.
Current usage metrics show cumulative count of Article Views (full-text article views including HTML views, PDF and ePub downloads, according to the available data) and Abstracts Views on Vision4Press platform.
Data correspond to usage on the plateform after 2015. The current usage metrics is available 48-96 hours after online publication and is updated daily on week days.
Initial download of the metrics may take a while.