Fig. 10.
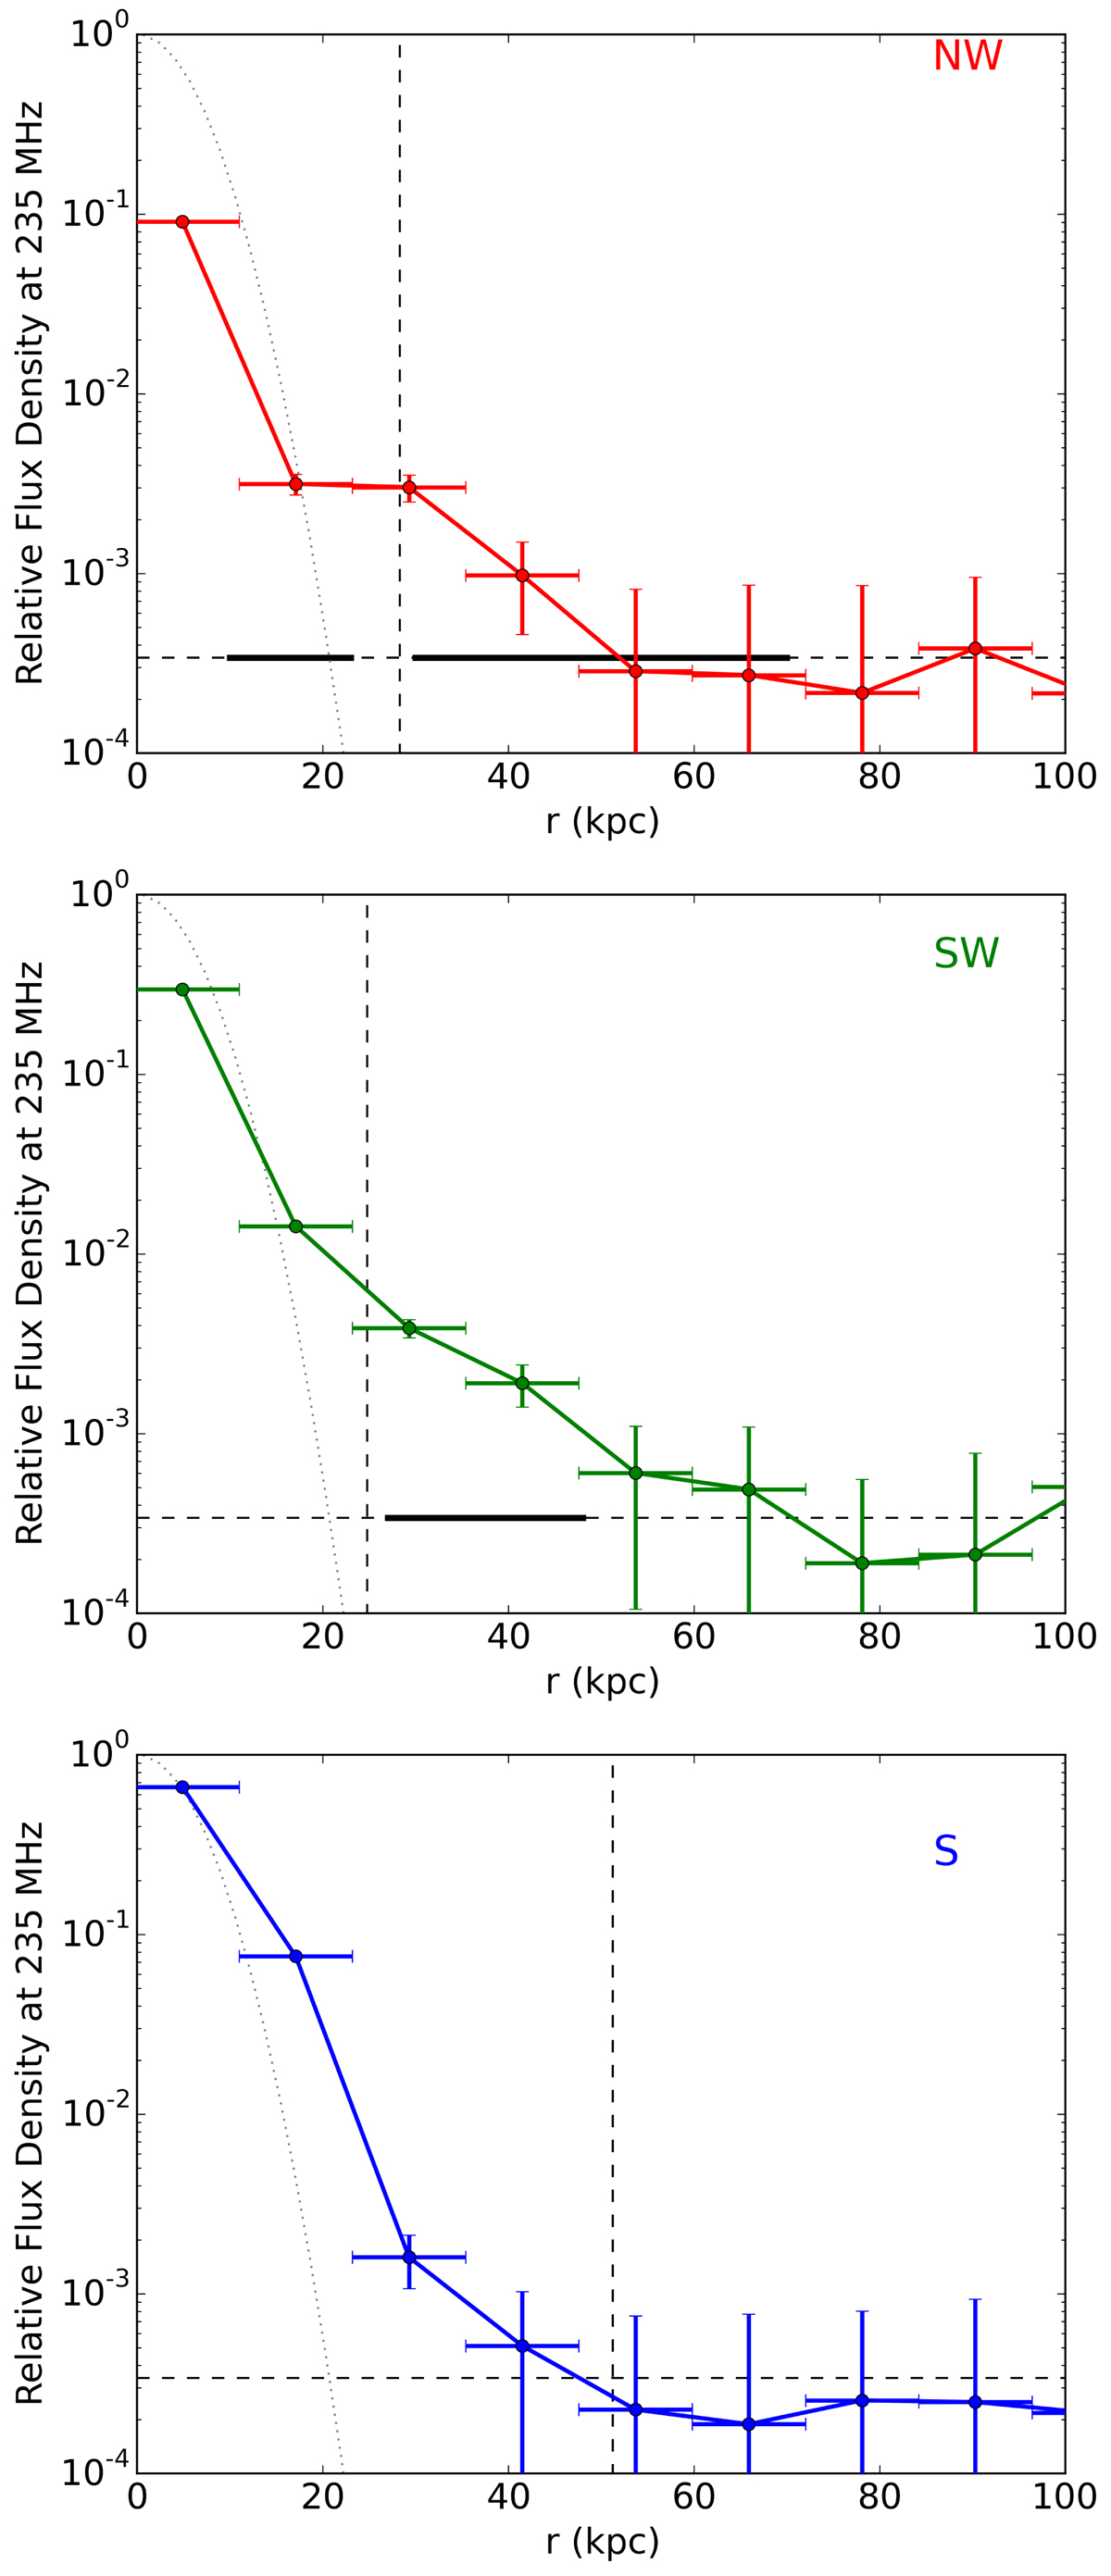
Radial radio profiles at 235 MHz in the NW (top panel), SW (middle panel), and S (bottom panel) directions. The vertical lines give the positions of the NW edge, SW edge, and the end of the S tail, as determined from the X-ray residual map (Fig. 7). The horizontal dashed line indicates the rms noise level in the image. The black stripes show the extent of the depressions as constrained from the X-ray surface brightness ratio profiles (Figs. 8 and 9). A Gaussian characteristic of the beam is shown with a gray dotted line to emphasize that the observed extended radio structures are significant in comparison with the beam size. The flux density is presented in relative units with respect to the peak flux measured at the center of A1795.
Current usage metrics show cumulative count of Article Views (full-text article views including HTML views, PDF and ePub downloads, according to the available data) and Abstracts Views on Vision4Press platform.
Data correspond to usage on the plateform after 2015. The current usage metrics is available 48-96 hours after online publication and is updated daily on week days.
Initial download of the metrics may take a while.