Fig. 5.
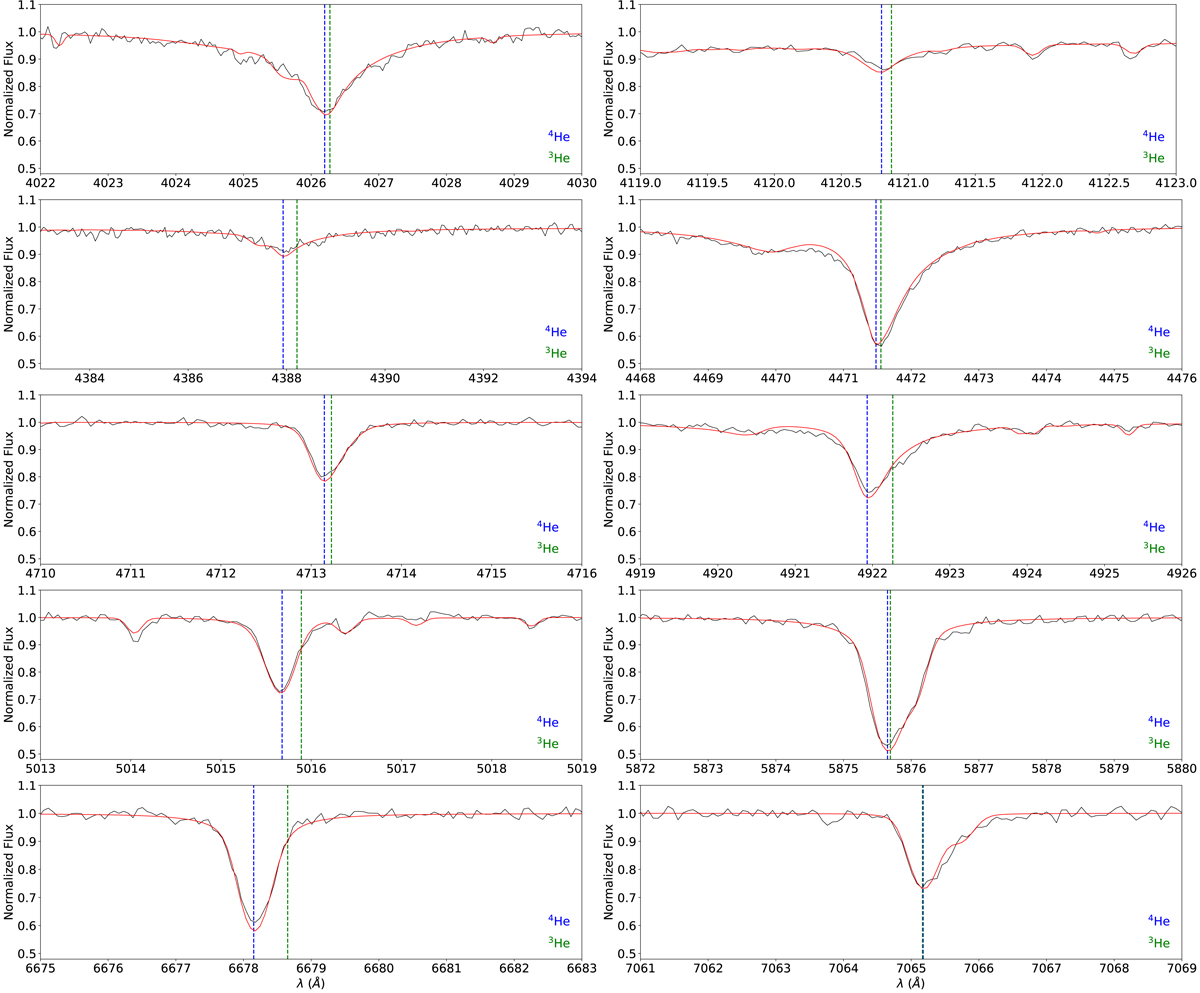
Selected He I helium lines in the FEROS spectrum of the He-normal comparison star HD 4539. The observed spectrum (solid black line) and the best fit (solid red line) are shown. The dashed vertical lines display the 3He (green) and 4He (blue) component of the individual helium line according to the wavelengths listed in Table 1.
Current usage metrics show cumulative count of Article Views (full-text article views including HTML views, PDF and ePub downloads, according to the available data) and Abstracts Views on Vision4Press platform.
Data correspond to usage on the plateform after 2015. The current usage metrics is available 48-96 hours after online publication and is updated daily on week days.
Initial download of the metrics may take a while.