Fig. 4.
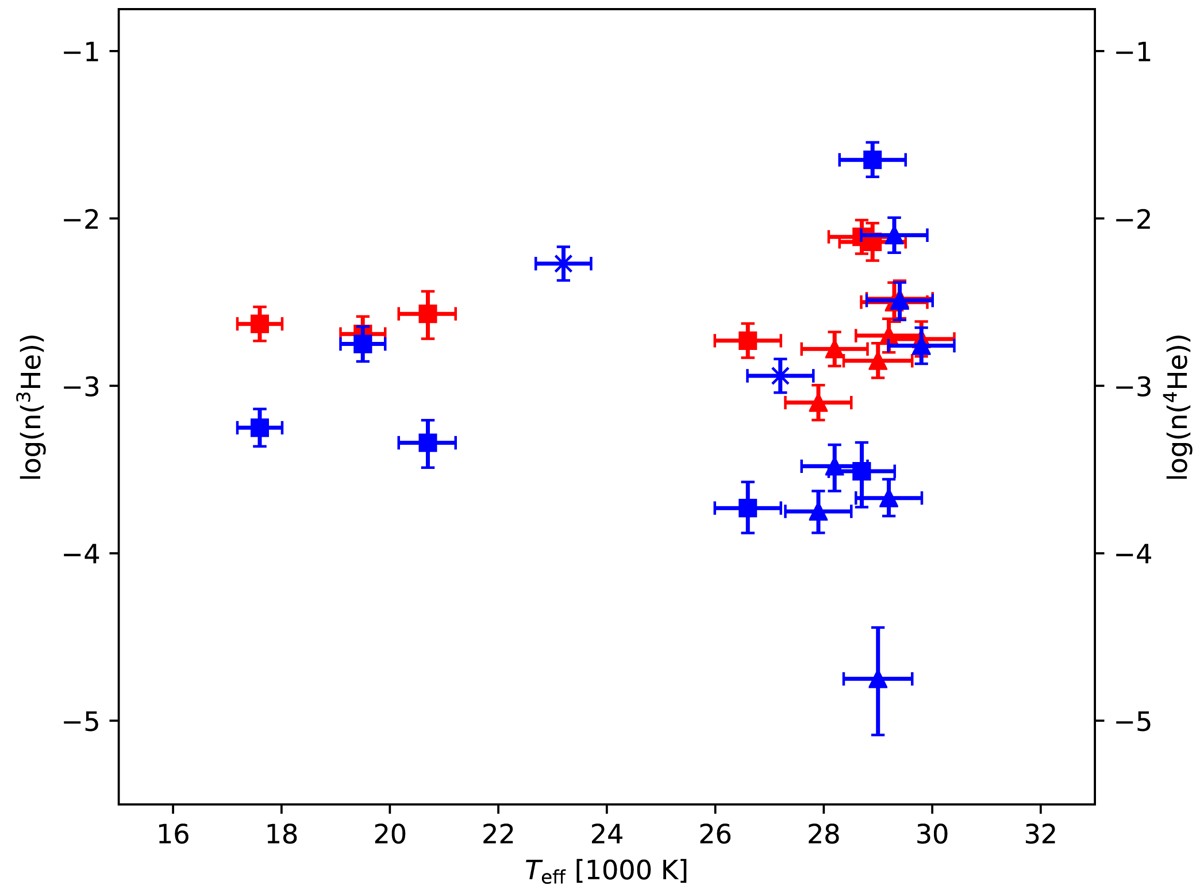
3He (red) and 4He (blue) abundances of the analyzed stars plotted against effective temperature. Stars showing anomalous helium line profiles (see Sect. 5.4) are marked with squares. Triangles represent 3He stars for which we were able to match the helium line profiles. In addition, both He-normal comparison stars (HD 4539 and CD-35° 15910) are marked with crosses. Their 3He upper limits (see Table 4) are not displayed.
Current usage metrics show cumulative count of Article Views (full-text article views including HTML views, PDF and ePub downloads, according to the available data) and Abstracts Views on Vision4Press platform.
Data correspond to usage on the plateform after 2015. The current usage metrics is available 48-96 hours after online publication and is updated daily on week days.
Initial download of the metrics may take a while.