Fig. 1.
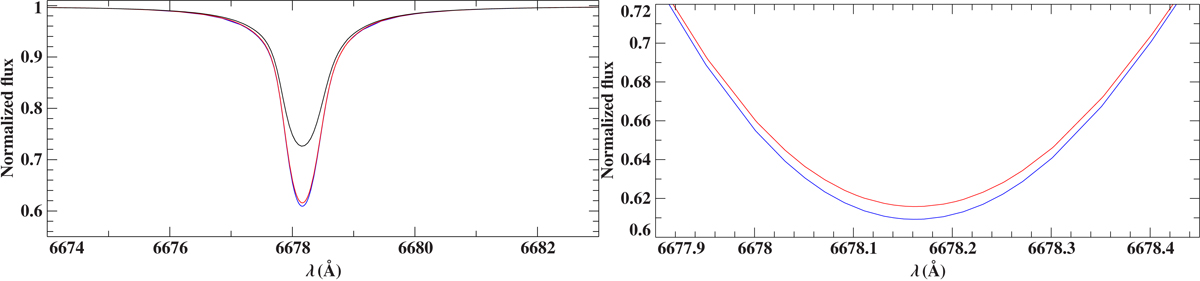
Left-hand panel: model spectra for He I 6678 Å calculated in LTE (black curve) and NLTE (red and blue curve) for Teff = 28000 K, log(g) = 5.60, and log(y) = −2.00. He I 6678 Å is clearly strongly affected by NLTE effects. While the red model is based on “old” Stark broadening tables for hydrogen and He I (Dimitrijevic & Sahal-Brechot 1990), the blue model uses “new” broadening tables from Beauchamp et al. (1997). Right-hand panel: same as the left-hand panel, but zoomed-in. The difference between the “old” (red curve) and “new” (blue curve) model is marginal, but sufficient in order to explain small deviations in atmospheric parameter determination (see Sect. 3.1 for details).
Current usage metrics show cumulative count of Article Views (full-text article views including HTML views, PDF and ePub downloads, according to the available data) and Abstracts Views on Vision4Press platform.
Data correspond to usage on the plateform after 2015. The current usage metrics is available 48-96 hours after online publication and is updated daily on week days.
Initial download of the metrics may take a while.