Fig. A.9.
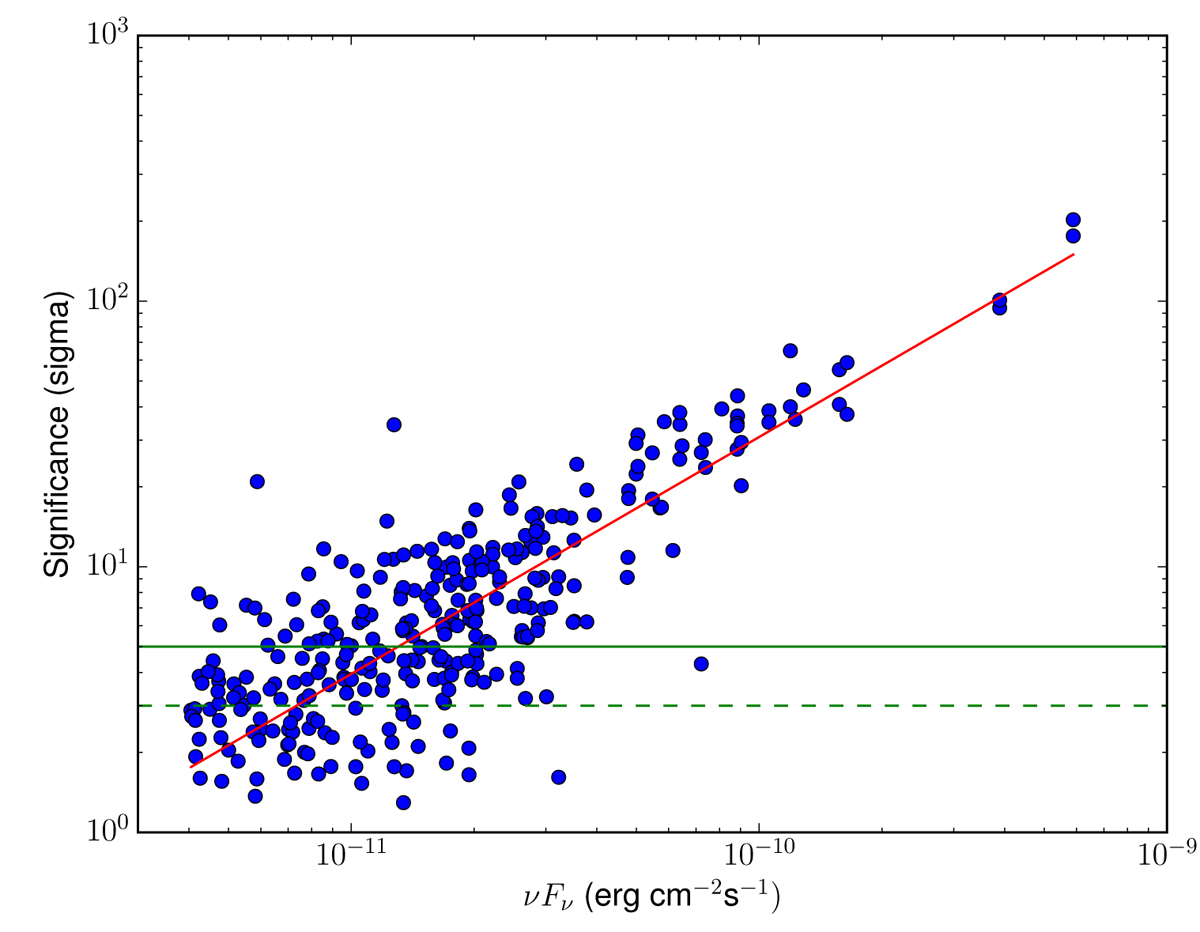
PGWave significance vs. input MC flux (setup containing extrapolated 3FGL sources with randomized position). The red line represents the best fit with a power-law function (f = kxα). In green: with a continues line, is shown the 5σ significance used for estimating the statistical sensitivity, instead with a dashed line is shown the 3σ significance threshold applied for the point source detection.
Current usage metrics show cumulative count of Article Views (full-text article views including HTML views, PDF and ePub downloads, according to the available data) and Abstracts Views on Vision4Press platform.
Data correspond to usage on the plateform after 2015. The current usage metrics is available 48-96 hours after online publication and is updated daily on week days.
Initial download of the metrics may take a while.