Fig. A.7.
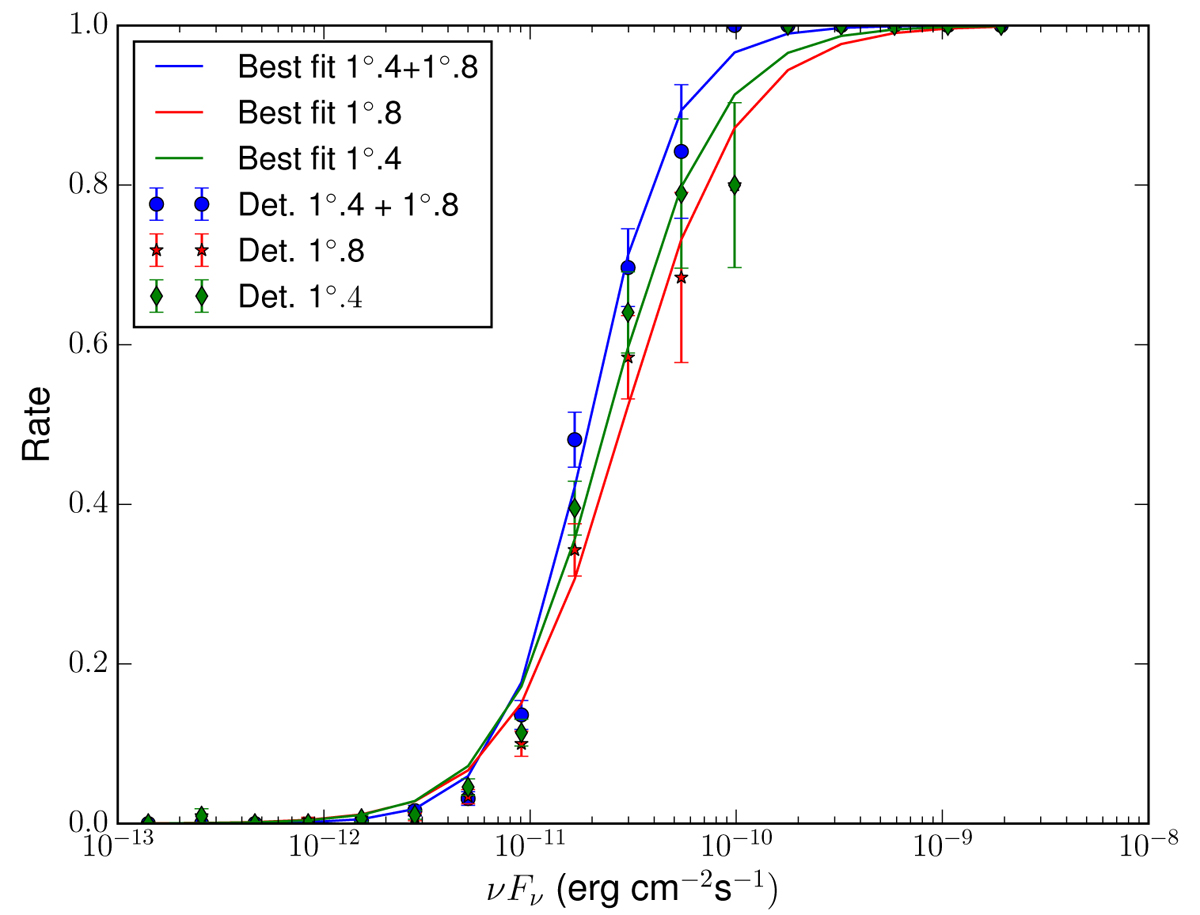
Detection rate as a function of the input flux of the simulated PS with random position in the sky (setup containing extrapolated 3FGL sources with randomized position) for high latitude sources, namely |b| > 10°. Each point represents the ratio of detected sources using PGWave withrespecttothenumberofinputsourceswithafluxvalueinsidethefluxbin. In blue the detection rate of the combined analysis (wavelet scales of 1°̣4 and 1°̣8), in red the same for the analysis with a wavelet scale of 1°̣8 only and in green for that one with a wavelet scale of 1°̣4 only.
Current usage metrics show cumulative count of Article Views (full-text article views including HTML views, PDF and ePub downloads, according to the available data) and Abstracts Views on Vision4Press platform.
Data correspond to usage on the plateform after 2015. The current usage metrics is available 48-96 hours after online publication and is updated daily on week days.
Initial download of the metrics may take a while.