Free Access
Fig. A.5.
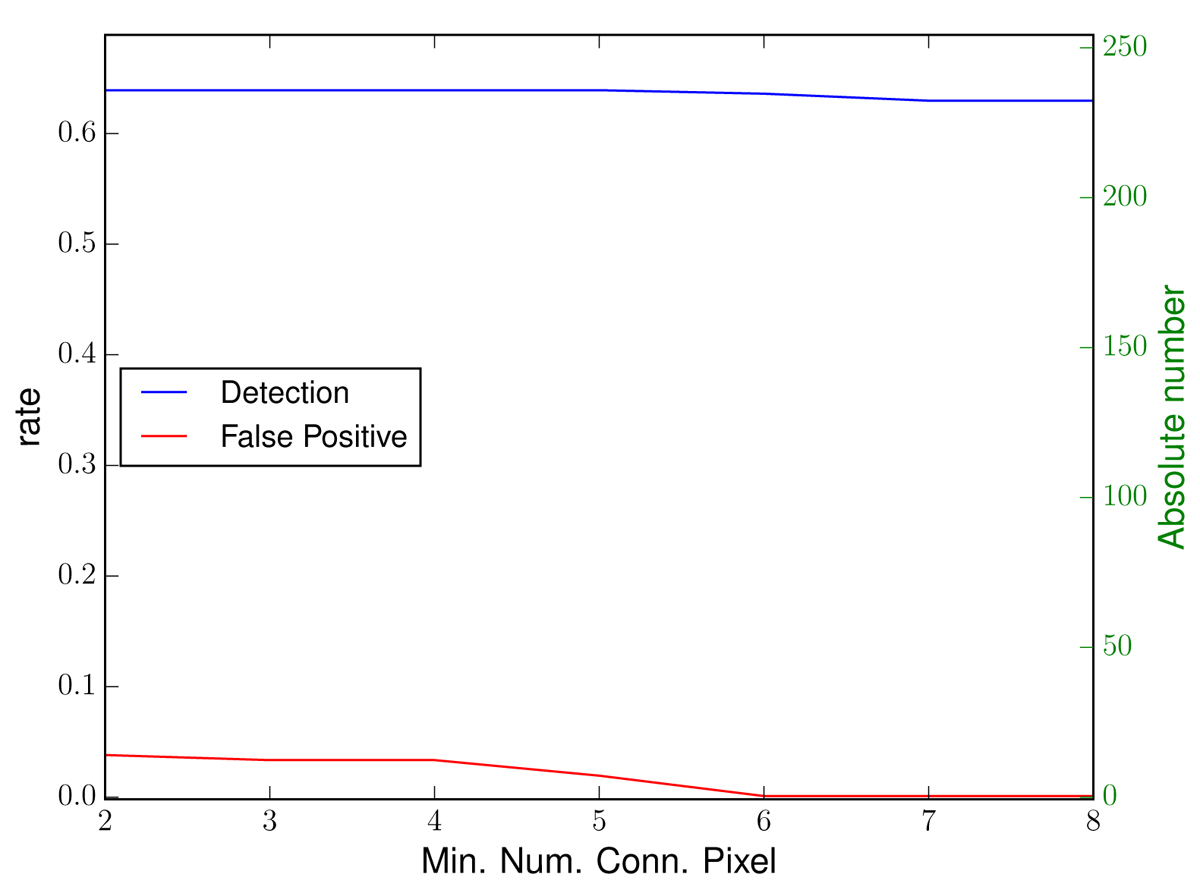
Detection (blue line) and false positive (red line) rates as a function of the minimum number of connected pixels (setup containing 369 PS with flat SdN/dS and random positions). The plot refers to the 30–100 MeV band.
Current usage metrics show cumulative count of Article Views (full-text article views including HTML views, PDF and ePub downloads, according to the available data) and Abstracts Views on Vision4Press platform.
Data correspond to usage on the plateform after 2015. The current usage metrics is available 48-96 hours after online publication and is updated daily on week days.
Initial download of the metrics may take a while.