Free Access
Fig. 11.
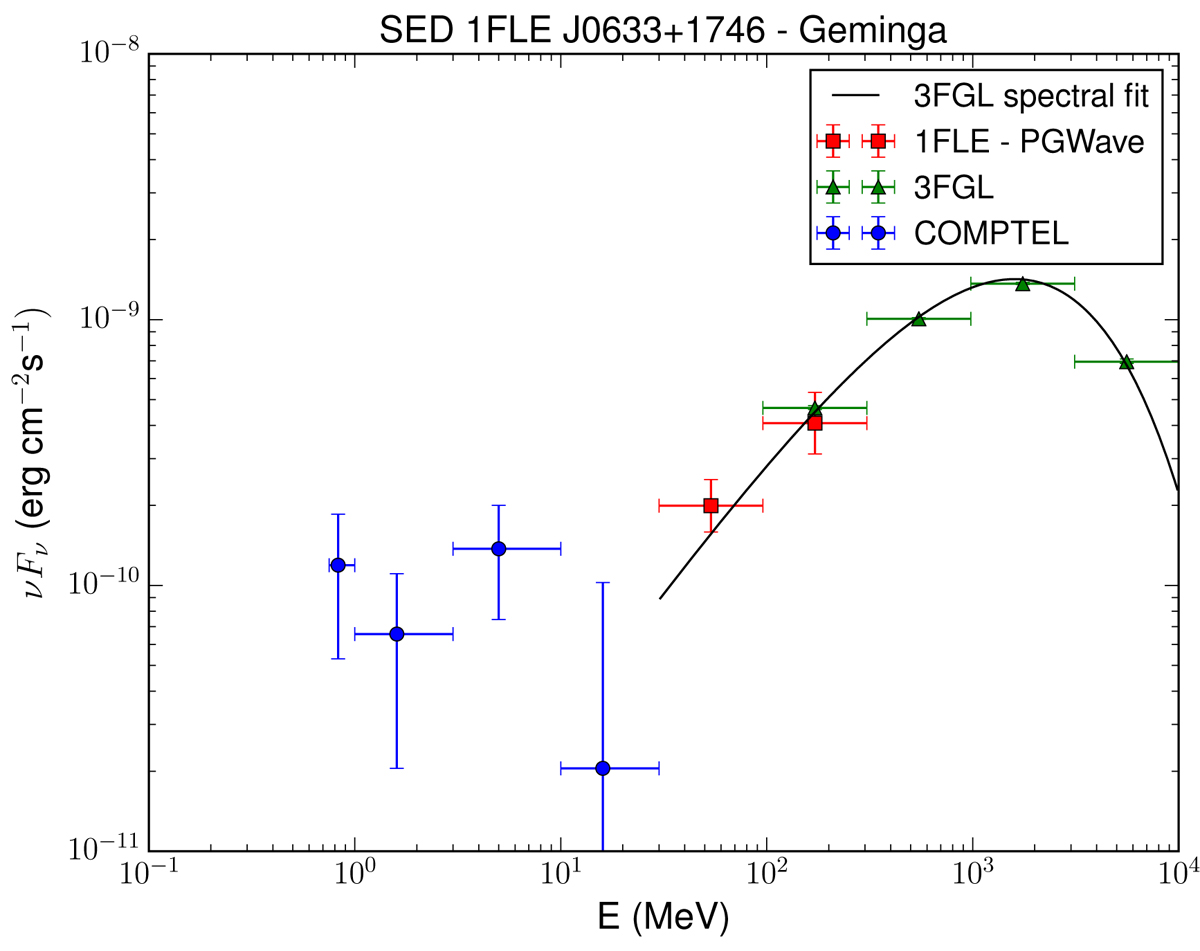
Spectral energy distribution of Geminga. Red squares: flux derived with the PGWave analysis (interval time 2008–2017), blue circles: COMPTEL flux values (interval time 1991–2000), green triangles: flux from the 3FGL catalog (interval time 2008–2012), black line: 3FGL spectral fit.
Current usage metrics show cumulative count of Article Views (full-text article views including HTML views, PDF and ePub downloads, according to the available data) and Abstracts Views on Vision4Press platform.
Data correspond to usage on the plateform after 2015. The current usage metrics is available 48-96 hours after online publication and is updated daily on week days.
Initial download of the metrics may take a while.