Free Access
Fig. 1.
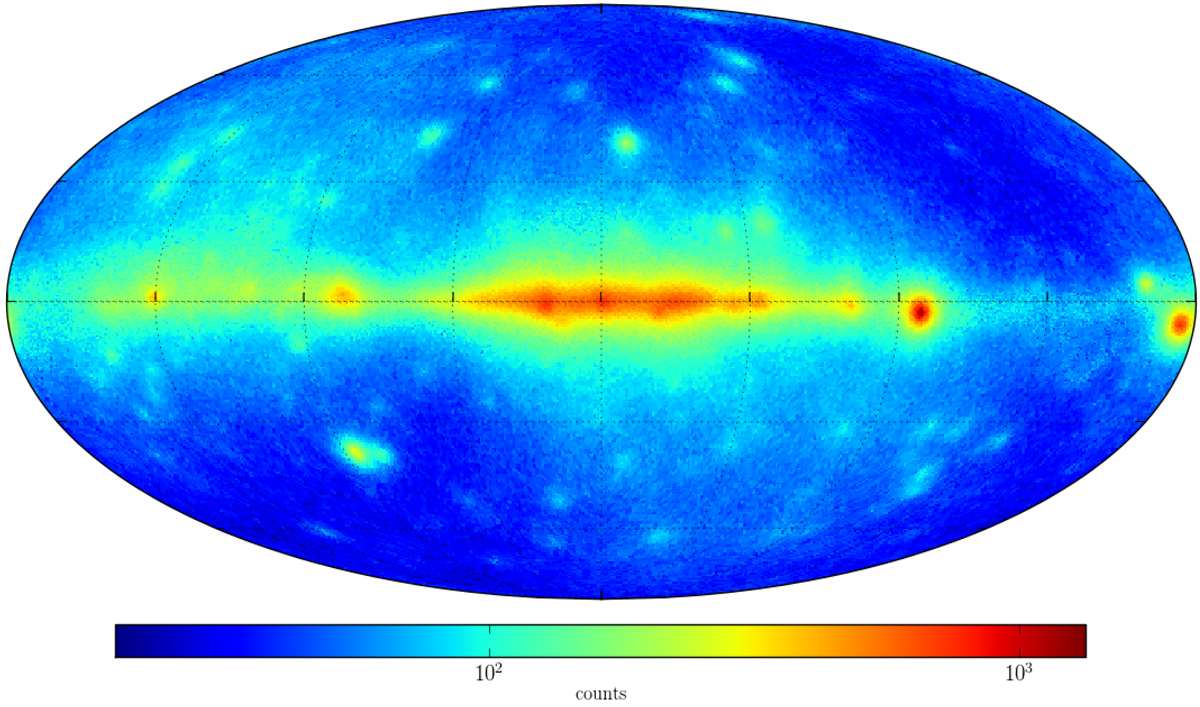
Fermi-LAT count map, for the first eight years and nine months of observation, in the 30–100 MeV band represented in Galactic coordinates and Mollweide projection. The color scale is logarithmic and the units are counts per pixel (pixel size equal to 0°̣458).
Current usage metrics show cumulative count of Article Views (full-text article views including HTML views, PDF and ePub downloads, according to the available data) and Abstracts Views on Vision4Press platform.
Data correspond to usage on the plateform after 2015. The current usage metrics is available 48-96 hours after online publication and is updated daily on week days.
Initial download of the metrics may take a while.