Fig. B.1
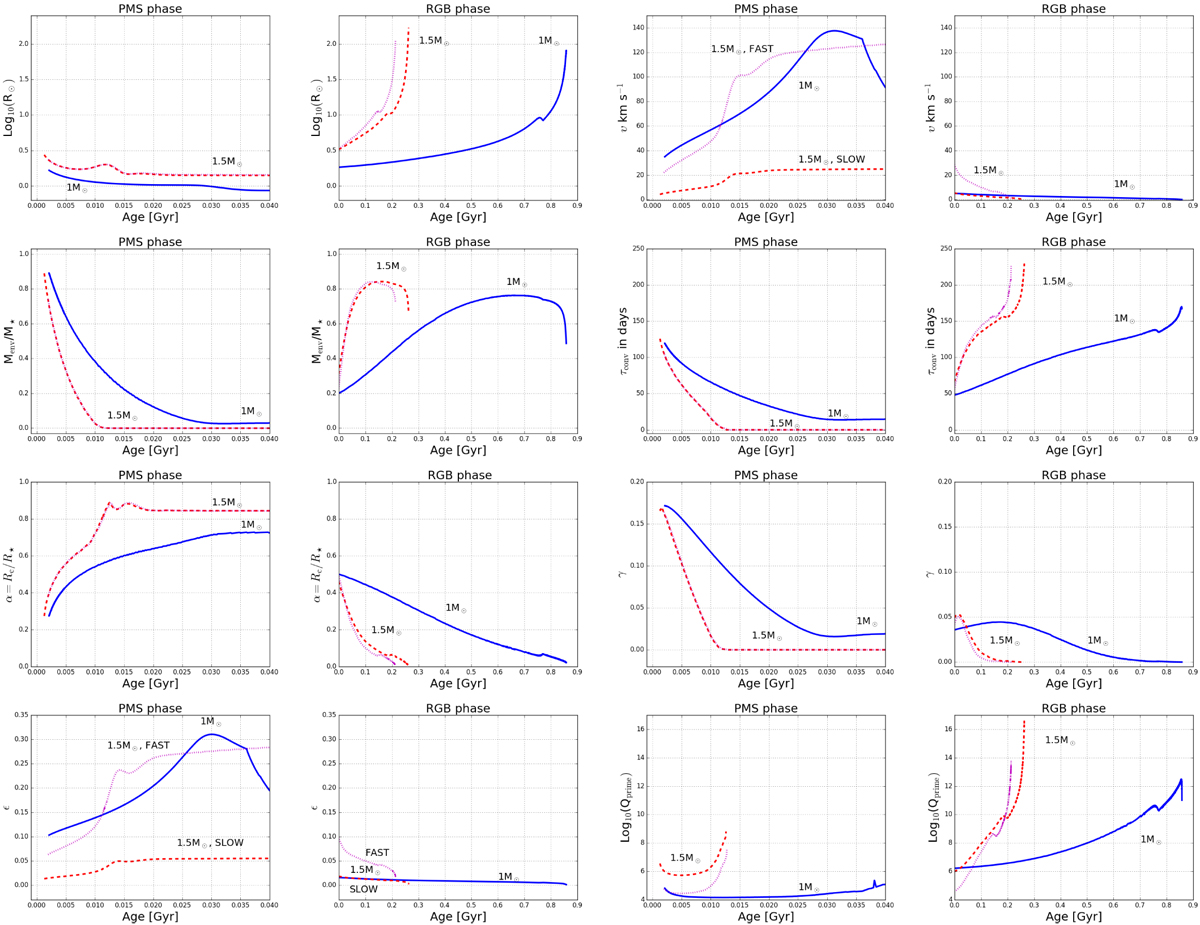
Evolution as a function of time of various stellar quantities during the PMS and RGB phase for 1 (continuous blue line) and 1.5 M⊙ stellar models. The 1.5 M⊙ stellar model has been computed with two initial rotation velocities, a slow (dashed red curves) and a fast velocity (dotted magenta curves). For the RGB phase, time equal to 0 corresponds to the local minimum of the luminosity before the ascent of the RGB. The first two columns of plots show (from top to bottom panels) the evolution of the stellar radius, of the mass fraction of the convective envelope, of the ratio between the radius of the stellar core (zone below the convective envelope), and the total radius and the ratio between the surface angular velocity and the Keplerian angular velocity. The last two columns show (from top to bottom panels) the evolution of the surface equatorial velocities, of the convective turnover time, of γ (the one appearing in Eqs. (6–8)), and Qprime, quantities needed for computing the dynamical tide. For comparison purposes, the range covered by the vertical axis is the same forthe PMS and RGB phase.
Current usage metrics show cumulative count of Article Views (full-text article views including HTML views, PDF and ePub downloads, according to the available data) and Abstracts Views on Vision4Press platform.
Data correspond to usage on the plateform after 2015. The current usage metrics is available 48-96 hours after online publication and is updated daily on week days.
Initial download of the metrics may take a while.