Fig. 5
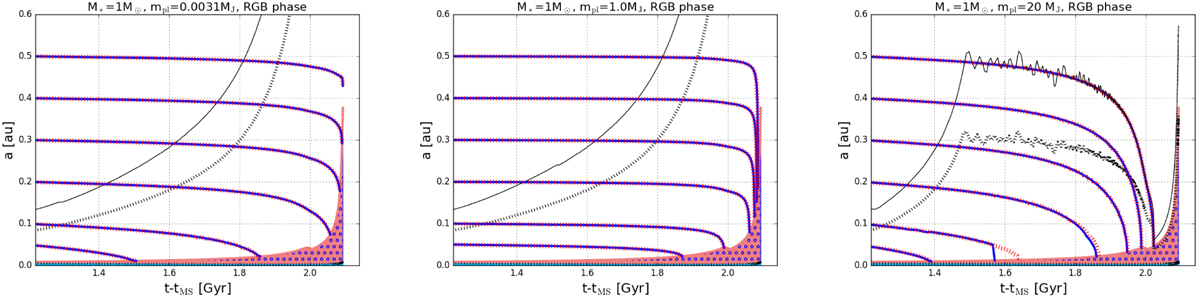
Evolution of the orbits of 0.0031 (mass of the Earth), 1 and 20 Jupiter mass planets around a 1 M⊙ star as a function of time t, where t − tMS = 0 corresponds to the end of the main-sequence lifetime. The continuous and dotted black curves are acorot and amin, respectively, which correspond to the cases where the initial distance is 0.5 au. The blue curves are the orbits computed with both the equilibrium and dynamical tides. The red tick curves (nearly always superposed on the continuous blue lines) are the orbits computed without the dynamical tide (only equilibrium tide).
Current usage metrics show cumulative count of Article Views (full-text article views including HTML views, PDF and ePub downloads, according to the available data) and Abstracts Views on Vision4Press platform.
Data correspond to usage on the plateform after 2015. The current usage metrics is available 48-96 hours after online publication and is updated daily on week days.
Initial download of the metrics may take a while.